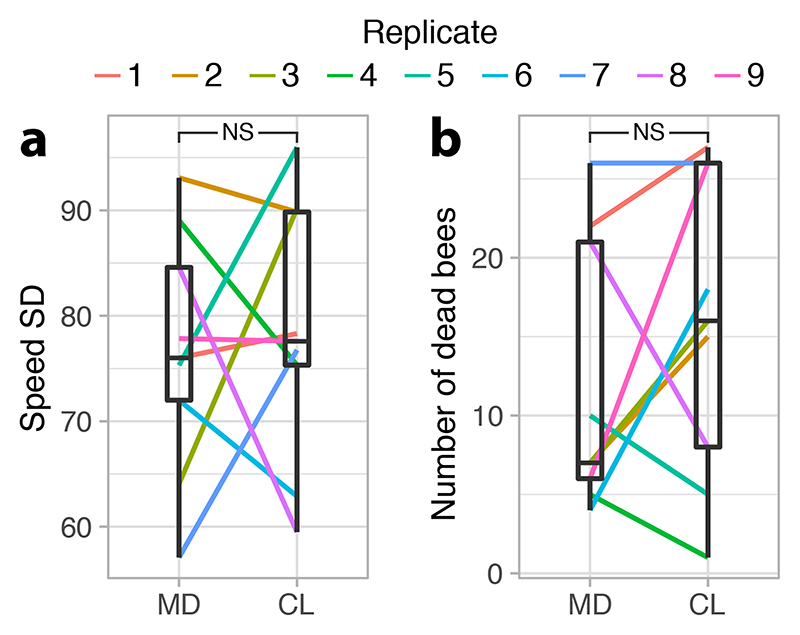
Extended Data Fig. 3. Average standard deviation of speed (pixels/s) (A) and mortality of tracked bees (B) per sub-colony during the 152 h of automated behavioral tracking.
Lines connect paired colonies in each experimental replicate. Boxplots show the median and first and third quartiles, while upper and lower whiskers report largest and lowest values within 1.5 times the interquartile ranges above and below the 75th and 25th percentiles, respectively. NS=not significant. n=18 sub-colonies examined over nine independent experiments.

