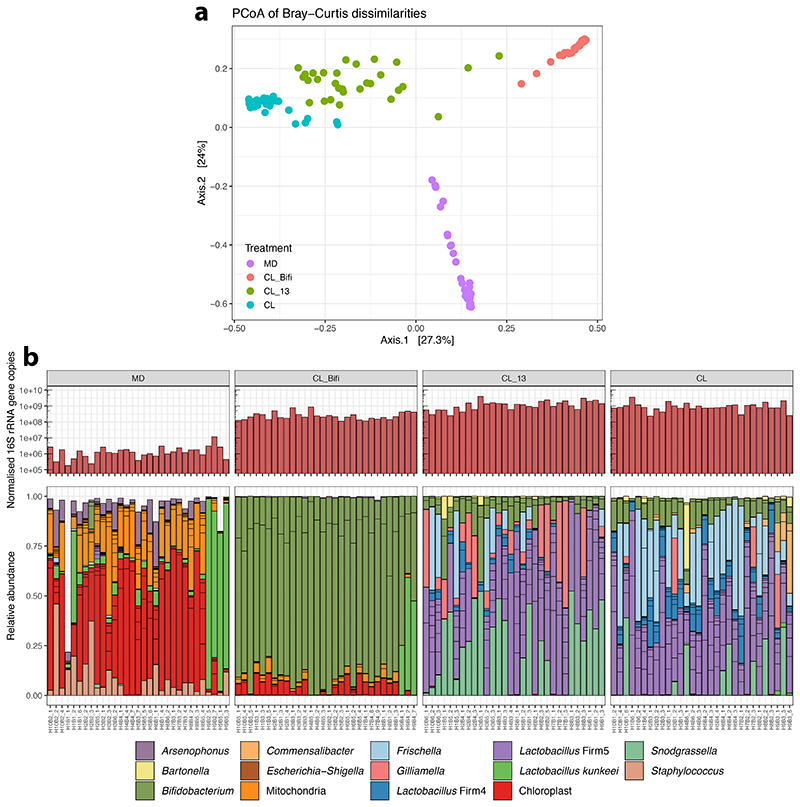
Extended Data Fig. 4. Bacterial loads and microbiota composition in the guts of bees of the RNA-sequencing experiment.
(A) Principal Coordinate Analysis of Bray-Curtis dissimilarities between gut microbiota profiles. Bray-Curtis dissimilarities were calculated from a matrix of absolute bacterial abundances of each amplicon-sequence variant (ASV) in each sample. Absolute abundances were obtained by multiplying the relative proportion of each ASV in each sample by the total number of 16S rRNA gene copies in the sample (normalised by Actin copy numbers). (B) The upper barplots depict the number of 16S rRNA gene copies measured by qPCR with universal bacterial primers and normalised by Actin copy numbers. Lower stacked bars indicate the relative abundance of community members. Sub-bars of the same color show distinct amplicon-sequence variants (ASVs) with the same classification. For ease of visualization, the stacked bars show only ASVs that had a minimum of 1% relative abundance in two samples.

