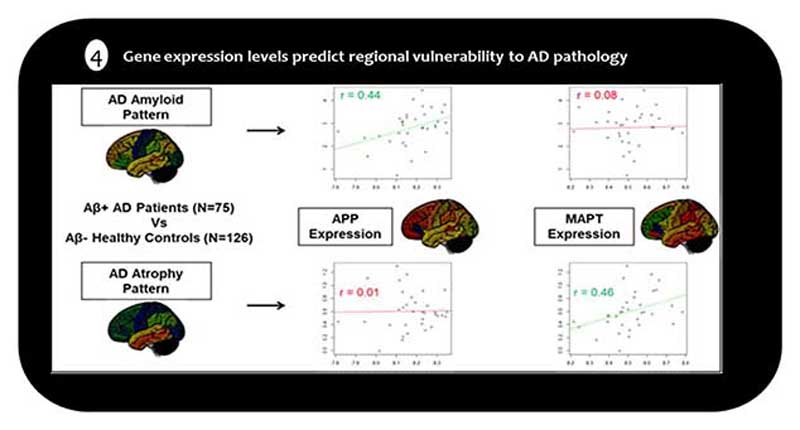
Figure 4.
Regional expression levels of APP and MAPT genes (x-axes) correlate differentially with the regional severities of amyloid deposition (top) and neurodegeneration (bottom) in AD patients as compared to healthy controls (y-axes). Each point corresponds to one of 34 different cortical areas; r indicates Spearman correlation across these areas. Adopted from Grothe et al., 2018

