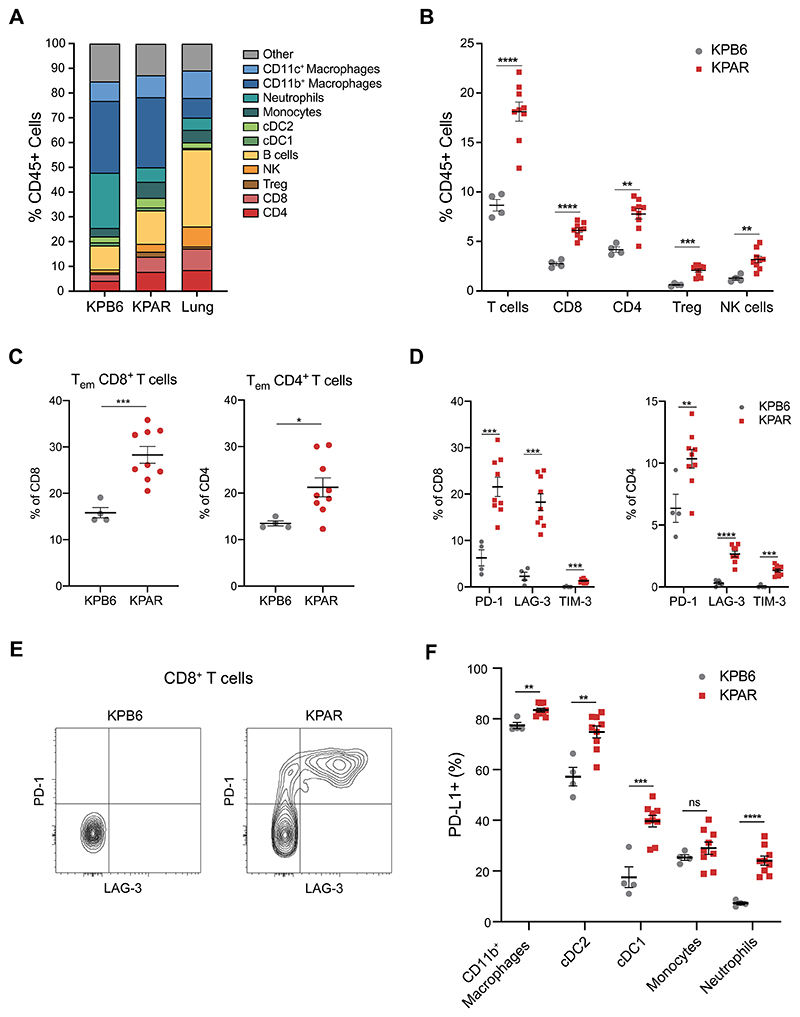
Figure 4. KPAR orthotopic tumours generate an adaptive immune response.
(A) Immune profile of KPAR and KPB6 orthotopic tumours compared to normal lung, assessed by flow cytometry.
(B) Frequency of tumour-infiltrating T cell populations and NK cells.
(C) Percentage of effector memory CD8+ (left) and CD4+ (right) T cells.
(D) Quantification of PD-1, LAG-3 and TIM-3 expression on CD8+ (left) and CD4+ (right) T cells.
(E) Representative plot of PD-1 and LAG-3 expression on CD8+ T cells.
(F) Frequency of PDL1+ macrophages, cDC1, cDC2, monocytes and neutrophils. Tumours were analysed 21 days after transplantation. In (B)-(D) and (F), data are mean ± SEM, n=4 mice (KPB6) or 9 mice (KPAR), symbols represent pooled tumours from individual mice. Unpaired, two-tailed Student’s t-test; ns P>0.05, * P≤0.05, ** P≤0.01, *** P≤0.001, **** P≤0.0001.

