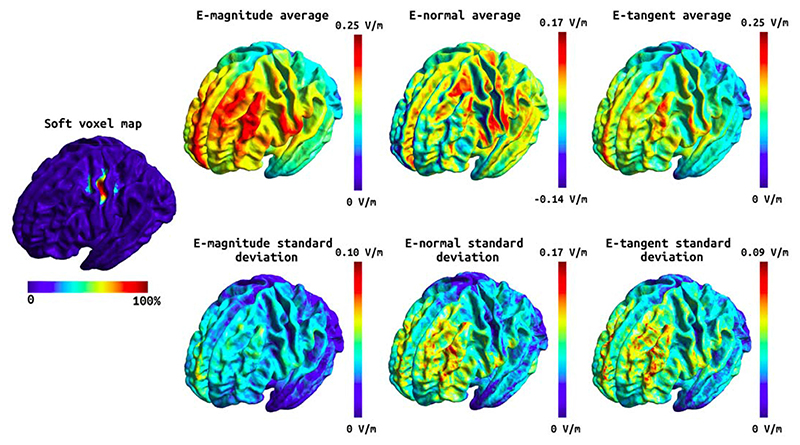
Fig. 2. Soft voxel map (leftmost) and the mean and standard deviation of the E-field components over the subjects in fsaverage space for the tDCS stimulation targeting the M1.
First column: the mean E-field magnitude (top) and its standard deviation (bottom). Second column: the mean E-field normal component (top) and its standard deviation (bottom). Third column: the mean E-field tangential component (top) and its standard deviation (bottom). Note that the normal component has directionality where positive (red) values denote currents flowing into the cortex and negative (blue) values denote currents flowing out of the cortex. (For interpretation of the references to colour in this figure legend, the reader is referred to the Web version of this article.)

