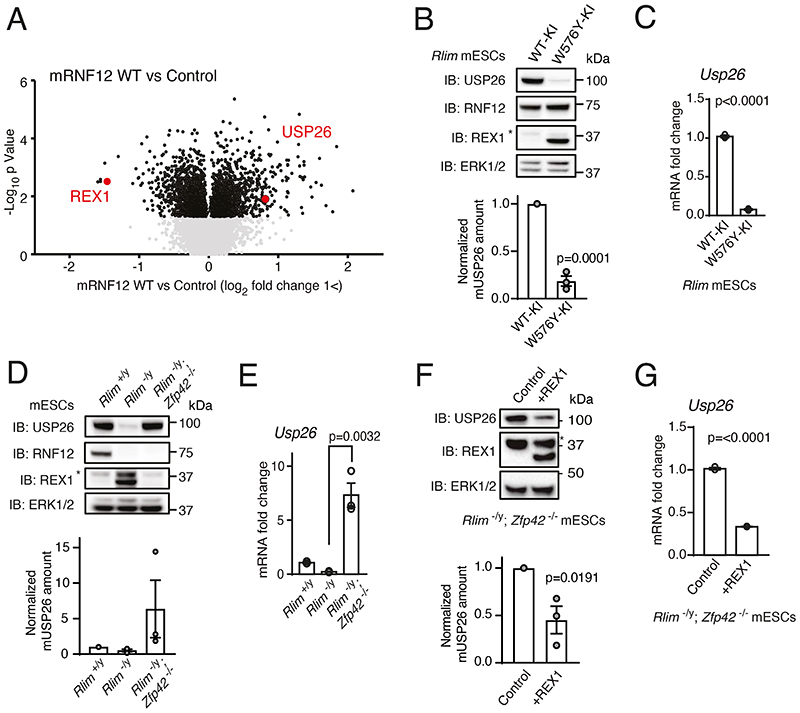
Fig. 1. The RNF12-REX1 signaling axis drives transcription of the X-linked gene Usp26.
(A) Quantitative proteomic analysis comparing RNF12-deficient (Rlim-/y) mESCs expressing empty vector (Control) or wild-type (WT) mouse RNF12 (mRNF12). USP26 and the known RNF12 substrate REX1 are highlighted. (B) Immunoblotting (IB) and quantification of RNF12, REX1, and USP26 in control RNF12 WT knock-in (WT-KI) and RNF12 catalytic mutant knock-in (W576Y-KI) mESCs. ERK1/2 is a loading control. The asterisk marks a non-specific band. Data represented as mean ± S.E.M. Statistical significance was determined by paired T-test; confidence level 95%. (C) Quantification of Usp26 mRNA in RNF12 WT-KI and W576Y-KI mESCs by qRT-PCR. Data represented as mean ± S.E.M. Statistical significance was determined by paired T-test; confidence level 95%. (D) Immunoblotting and quantification of RNF12, REX1, and USP26 in control (Rlim+/y), Rlim-/y, and RNF12;REX1 double knockout (Rlim-/y; Zfp42-/-) mESCs. Data represented as mean ± S.E.M. (E) Quantification of Usp26 mRNA in Rlim+/y, Rlim-/y, and Rlim-/y; Zfp42-/- mESCs by qRT-PCR analysis. Data represented as mean ± S.E.M. Statistical significance was determined by paired T-test; confidence level 95%. (F) Immunoblotting and quantification of USP26 and REX1 in Rlim-/y; Zfp42-/- mESCs expressing empty vector (Control) or REX1. Data represented as mean ± S.E.M. Statistical significance was determined by paired T-test; confidence level 95%. (G) Quantification of Usp26 mRNA in Rlim-/y; Zfp42-/- mESCs expressing empty vector (Control) or REX1 by qRT-PCR analysis. Data represented as mean ± S.E.M. Statistical significance was determined by paired T-test; confidence level 95%. For all panels, n = 3 independent experiments.

