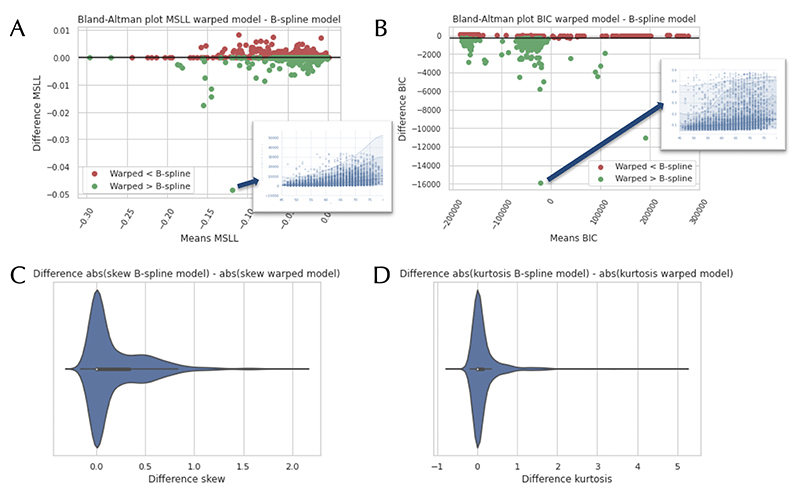
Figure 2. Bland-Altman plots comparing the B-spline and warped Bayesian Linear Regression (BLR) models, using Image-Derived Phenotypes (IDPs).
The models are compared according to the following model selection criteria: the Mean Standardized Log Loss (MSLL) (A) and the Bayesian Information Criteria (BIC) (B). The green colour indicates a better fit for the warped model compared to the B-spline model. We also plotted a zoomed-in view of the model fit for two of the IDPs. On images C and D, we show the difference in absolute values of the skewness and kurtosis between the B-spline and warped model. A more positive value indicates that the B-spline model had a higher skewness or kurtosis than the warped model.

