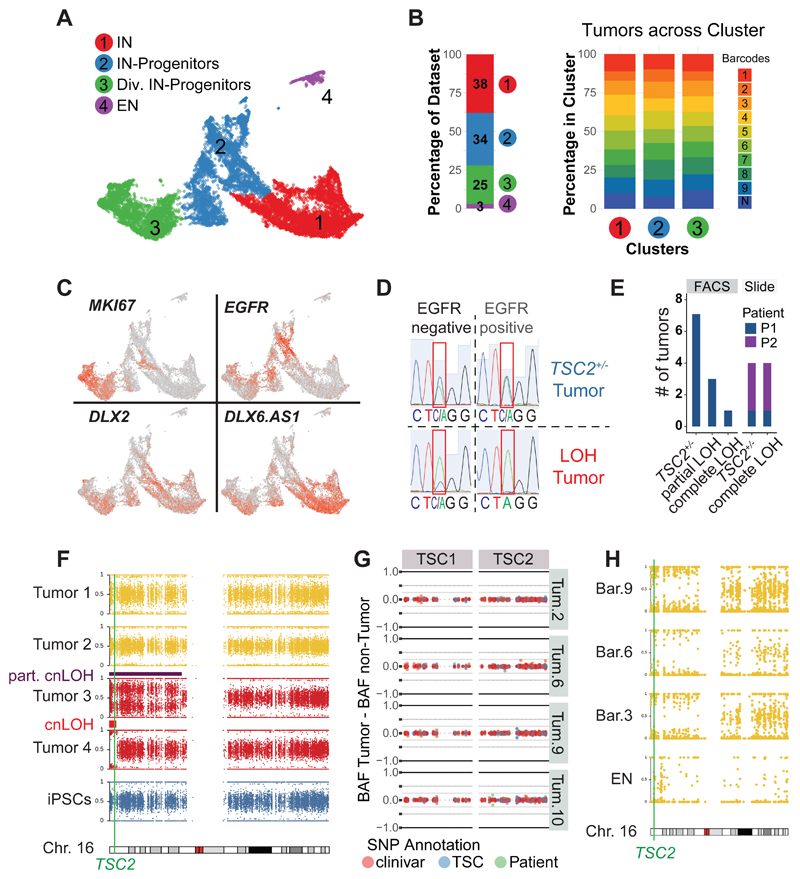
Fig 2. TSC tumors consist of interneuron progenitors and acquire cnLOH during progression.
A UMAP projection of cells isolated from 220-day-old TSC tumor organoids identified four main clusters: interneurons (Cl. 1), interneuron progenitors (Cl. 2), dividing interneuron progenitors (Cl. 3) and excitatory neurons (Cl. 4).
B Dataset composition and contribution of different tumor regions. 97% of cells in tumors were ventral cells and all nine tumor regions of three organoids were similarly distributed across ventral clusters (Cl. 1, 2 and 3).
C Expression of genes specific for dividing cells (MKI67) and interneurons (DLX2 and DLX6.AS1) in 220-day-old TSC tumors. EGFR was specifically expressed in TSC tumor progenitors.
D Genotyping example of FACS sorted tumor (EGFR+) and non-tumor (EGFR-) population, showing a heterozygous tumor and a LOH (loss-of-heterozygosity) tumor that lost the WT-allele (C) within the tumor.
E Genotyping of tumors of patient 1 in FACS sorted samples showing 7 out of 11 TSC tumors were heterozygous, three showed a partial LOH, and one tumor showed a full LOH. Genotyping tumors from stained slides confirmed the presence of heterozygous and LOH tumors (patient 1: one TSC2+/- tumor, one LOH tumor; patient 2: three TSC2+/- tumors, three LOH tumors)
F B-Allele frequency (BAF) of chromosome 16 for four tumors of Pat. 1 TSC2+/--derived organoids. While tumor 1 and 2 remain heterozygous, a shift in BAF is seen in tumors 3 and 4 compared to iPSCs. See Fig. S6L for BAF and LRR. Note that tumor 2 showed a partial cnLOH of a large section, while tumor 4 had a small complete cnLOH at the beginning of chromosome 16. Both cnLOH regions included the TSC2 gene.
G Targeted amplification of TSC1 and TSC2 in four tumors and matched non-tumor samples of patient 1. Detected SNPs are colored as annotation of clinivar database (red), LOVD TSC database (blue) or disease-causing SNP of patient 1 (green). The difference between BAF of the tumor and matched non-tumor sample is shown. No disease-causing SNPs increased in the tumor samples could be detected. Note that in tumor 10 there was a small shift of the patient SNP, confirmed as partial cnLOH (Fig. S6I).
H SNP mapping of scRNA seq data shown in panel A. Cells from tumors with sufficient reads (barcodes 3, 6 and 9) and excitatory neurons were aggregated per group and allelic frequencies were determined. All tumors showed cnLOH, while excitatory neurons (cluster 4, Fig 2A) remained heterozygous.

