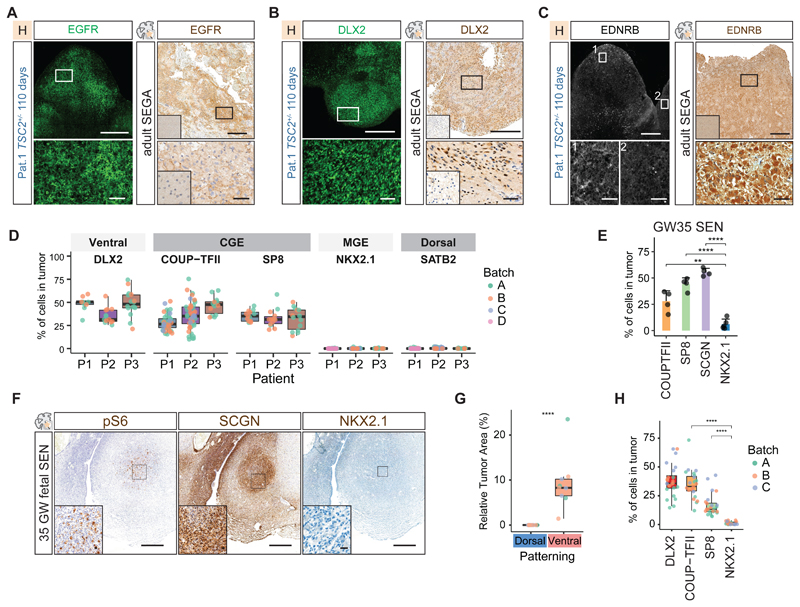
Fig 4. CGE progenitors initiate TSC tumors.
A Immunostaining for EGFR identified tumors in 110-day-old TSC2+/--derived organoids grown in H-medium. EGFR expression was present in adult SEGAs. Inset in primary tissue staining shows healthy control cortex negative for EGFR (See Fig. S12C for co-staining with COUP-TFII in organoids).
B DLX2 was expressed in tumors in 110-day-old TSC2+/--derived organoids and resected SEGA tissue. Inset in primary tissue staining shows healthy control cortex negative for DLX2 (Fig. S13, See Fig. S13 for EGFR and SP8 in organoid and patient tumors).
C EDNRB was expressed in tumors in 110-day-old TSC2+/--derived organoids. Zoom-in 1 and 2; tumor regions expressing EDNRB and negative region. See Fig. S16A for co-staining with PROX1 and pS6 in two patients. EDNRB expression was found in adult SEGAs. Inset in primary tissue staining shows healthy control cortex negative for EDNRB.
D Quantification of ventral (DLX2), CGE (COUP-TFII and SP8), MGE (NKX2.1) and dorsal markers (SATB2) in tumors of three patients. Tumors of at least two independent batches were quantified shown by different colors. Ventral and CGE markers are found in all tumors, MGE and dorsal markers are not found (See Fig. S14B for statistical comparison).
E Quantification of CGE markers COUP-TFII, SCGN, SP8 and MGE marker NKX2.1 in 35GW fetal SENs (mean and standard deviation, see Fig. S14D for statistical comparison).
F Immunostaining on fetal SENs. Fetal tumors characteristically expressed Vimentin (Fig. S14C) and pS6 in enlarged cells. Tumor were enriched in SCGN expressing CGE interneurons. Only few MGE cells were found.
G Dorsal and ventral patterning of tumors of patient 1. In 120-day-old TSC2+/--derived organoids tumors only appear in ventral patterned organoids containing interneuron progenitors (Student's t-test, see Fig. S15B. for overview of samples).
H Tumors in ventral patterned organoids expressed the ventral marker DLX2 and the CGE markers COUP-TFII and SP8, while NKX2.1 is almost absent (Ordinary one-way ANOVA with Tukey HSD, see Fig. S15H for statistical comparison).
Scale bars: overview images A, B, C: 500μm; Zoom-in A, B, C: 50μm; overview F: 500μm; Inset F: 20μm

