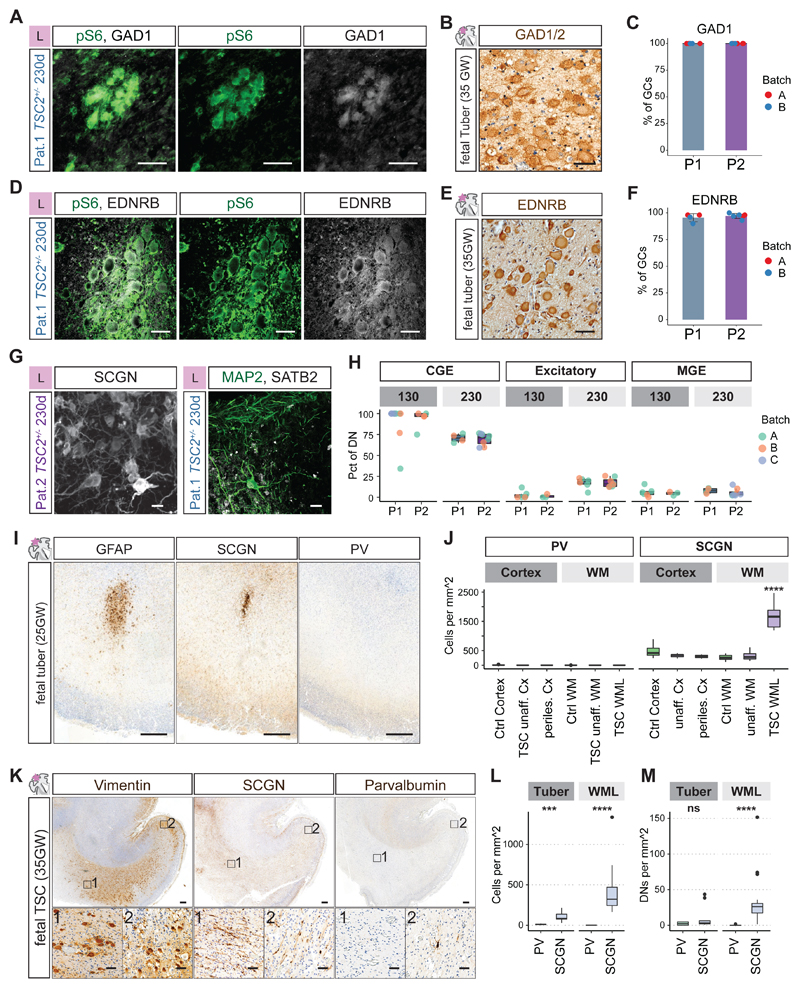
Fig 5. CLIP cells initiate cortical tuber pathogenesis.
A and B GCs in organoids (A) and fetal tubers (B) expressed the interneuron lineage marker GAD1.
C Quantification of co-expression of GAD1 and pS6 in giant cells in organoids (P1: N = 2, n = 6, mean = 100%; P2: N = 2, n = 8, mean = 100%)
D and E EDNRB was expressed in GCs in organoids and in fetal tubers.
F Quantification of co-expression of EDNRB and pS6 in GCs in organoids (P1: N = 2, n = 4, mean = 95.5%; P2: N = 2, n = 6, mean = 97.2%).
G Dysmorphic neurons at 230 days expressed the CGE-marker SCGN. Individual dysmorphic neurons expressed the excitatory marker SATB2 (See Fig. S20C-G for stainings at different timepoints).
H Quantification of expression of CGE (SCGN, COUP-TFII), excitatory (SATB2) and MGE markers (PV) in dysmorphic neurons (DNs) at early and late stages in organoids of two patients. CGE DNs were enriched at 130 days and decreased over time. Excitatory DNs increased over time. See Fig. S20I and J for statistical analysis.
I GFAP identified early dysplastic regions at 25GW located in the white matter below the cortex. There was a focal enrichment of SCGN expressing CGE interneurons, while PV expressing MGE interneurons were rare (See. Fig. S21A and B).
J Quantification of MGE marker PV and CGE marker SCGN in ~25GW fetal brain. Unaffected cortical areas, unaffected white matter, as well as white matter lesions (WML) and adjacent cortex (perilesional cortex) quantified for density of cells expressing PV or SCGN (Fig. S21A and B). WMLs were significantly enriched in CGE interneurons compared to all other regions (One-way ANOVA, see Fig. S21C and D for statistical analysis).
K At 35GW Vimentin staining identified streams of cells in WMLs and affected cortex. SCGN expressing cells were abundant in the WMLs, and cortex, while PV expressing cells were mainly found in cortical regions.
L and M Quantification of MGE marker PV and CGE marker SCGN in 35GW TSC case. Density of all cells is shown in L, with increase of SCGN cells in tuber and WML areas. In M the density of DNs expressing PV and SCGN in tuber and WML areas is shown. SCGN DNs were significantly enriched in WMLs, while tubers contained similar density of PV and SCGN cells (all neurons: Tuber p = 0.0002, WML p = <0.0001; DNs: Tuber p = 0.248, WML p = <0.0001; pairwise Wilcoxon-test, see Fig. S21E for overview of samples).
(Scale bars: A, B, D, E, inset K: 50μm; G: 20μm; overview I and K: 500μm)

