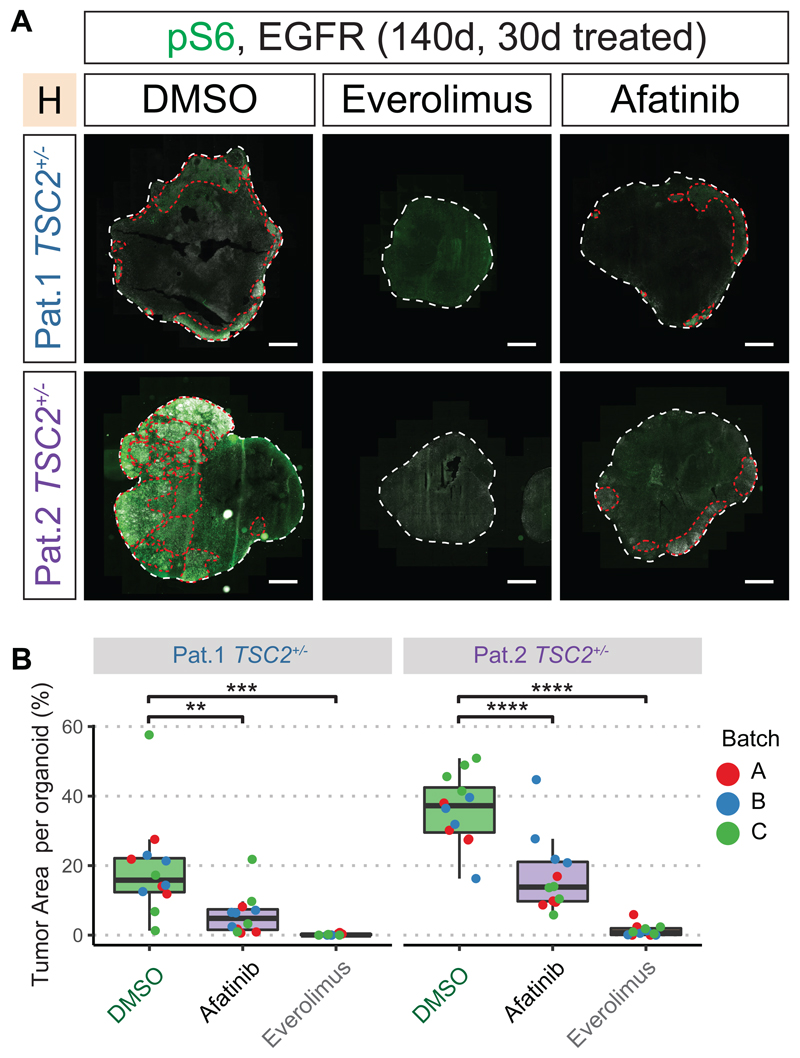
Fig 6. EGFR-inhibition reduces tumor burden.
A 30 days of treatment started at 110 days after EB formation (see Fig. S23A). Immunostaining for pS6 and EGFR identified tumors (red lines) in the control group (DMSO) in both patients. Tumors were reduced by Afatinib and Everolimus treatment.
B Quantification of tumor area per organoid. All sections of each organoid stained on one slide were used for quantification. Tumors were identified as regions of overlapping pS6 and EGFR staining. While tumors were detected in DMSO-control for both patients, Afatinib or Everolimus treatment both reduce tumor burden. (two-way ANOVA for treatment condition controlling for batches, Tukey's multiple comparisons test, see Fig. S23B)
(Scale bars: A.: 1mm)

