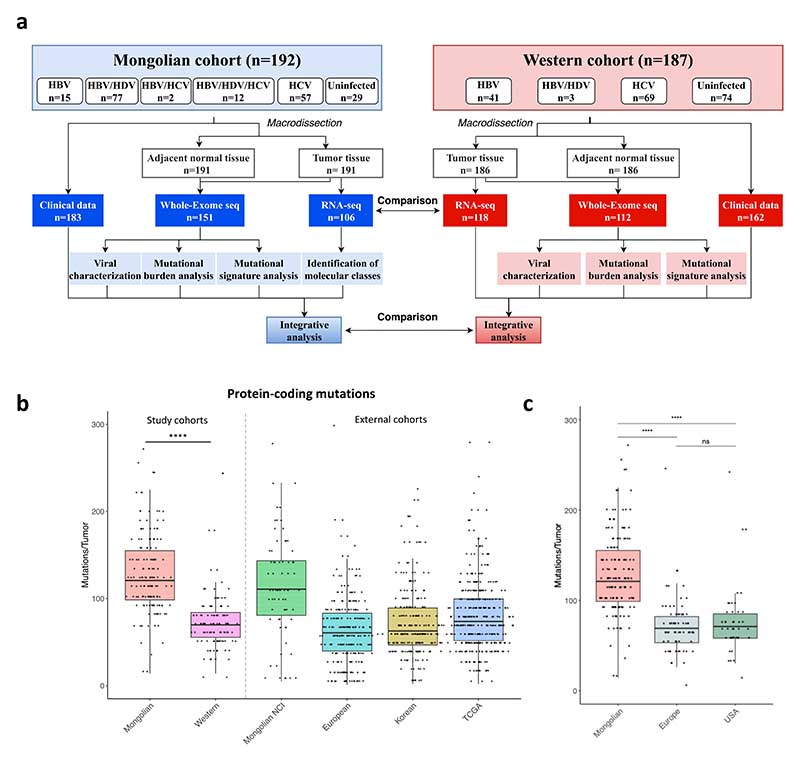
Figure 1. Flow chart of the study and mutational profile in Mongolian HCC.
a A total of 192 HCC samples from Mongolia were used in this study. A Western cohort including 187 HCCs was used as internal control. b Mutations per tumor in the Mongolian (n=151) and Western (n=112) cohorts. Mongolian NCI (n=71), European (n=241), Korean (n=231) and TCGA (n=363) external cohorts are shown as reference. c Mutations per tumor in Mongolian HCC (n=151) compared to Western HCC from Europe (n=69) and USA (n=43). Y axis was cut at 300 mutations/tumor to facilitate data interpretation. P-value corresponds to Kruskal-Wallis test. Box plots indicate median (middle line), 25th, 75th percentile (box) and 5th and 95th percentile (whiskers).

