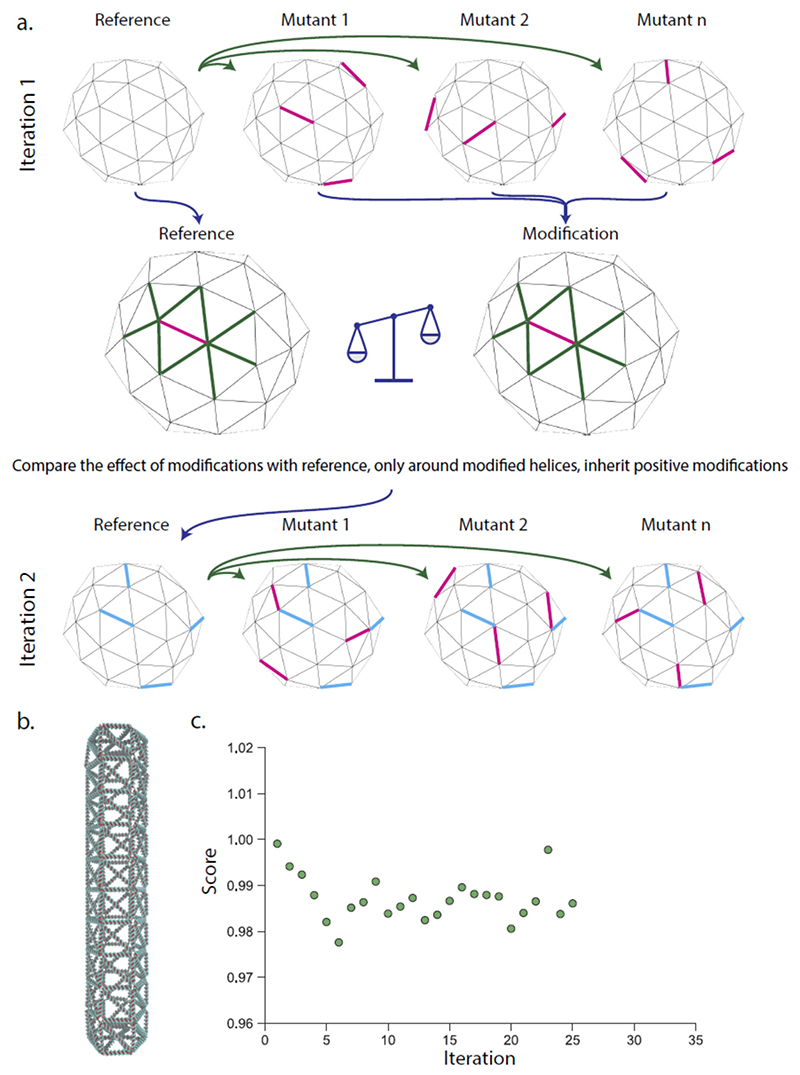
Figure 2. Multiplexed iterative evolution of DNA nanostructures.
a. The original structure is simulated together with mutant structures with several random modifications (magenta edges). The modifications are evaluated individually by scoring the change in the length fluctuations of the modified edge and its neighbors (green) and comparing this with the same edges on the reference. All modifications that improve the edge more than a threshold is then incorporated in the next iteration (blue edges). b. A full-size DNA origami rod was used as a template with up to 70 modifications per iteration. C) The progression of the fluctuations in the structure compare to the initial structure over 26 iterations. Here the score is the average standard deviation of the fluctuation in all edges of the structure compared to the initial structure. Additional analysis in supplementary figure 4.

