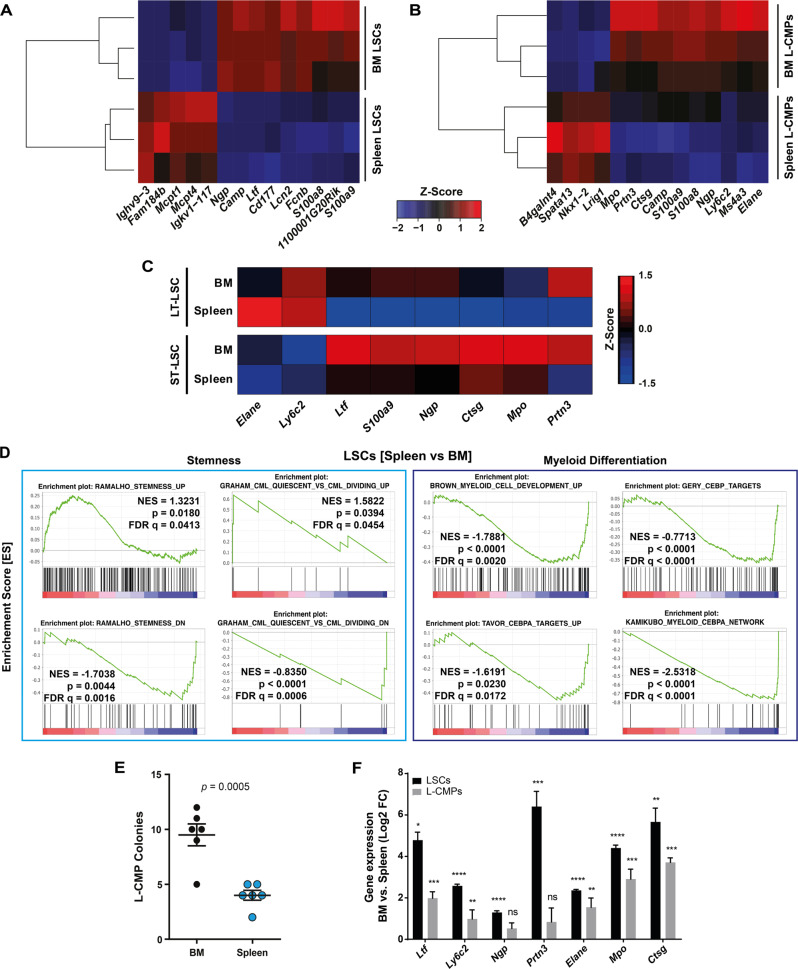
Fig. 3. Transcriptomic analysis of LSPCs in the spleen reveals enrichment in stemness and decreased lineage commitment.
A, B Heatmap visualizing the expression of the significantly differentially expressed genes in LSCs and L-CMPs. Rows and columns were grouped using unsupervised hierarchical clustering. C Expression of genes involved in myeloid expression in LT- and ST-LSCs from BM and spleen. Data were clustered using standard Euclidean’s method based on the average linkage and heatmaps were generated according to the standard normal distribution of the values. D Gene set enrichment analysis (GSEA) representing the normalized enrichment score (NES) and false discovery rate score (FDR) of gene sets linked to stemness and myeloid differentiation for LSCs (spleen vs. BM). E 103 FACS-purified L-CMPs from spleen and BM of CML mice were plated into methylcellulose and colonies were counted 7 days later. One representative experiment out of 3 is shown with n = 6 mice per group. F LSCs and L-CMPs from spleen were co-cultured for 36 h with spleen and BM flush as supernatants. Depicted are log2 fold changes in gene expression in LSCs and L-CMP cultured with BM or spleen flush supernatant. One representative experiment out of 2 is shown with n = 3 biological replicates. Data are displayed as mean ± SEM. Statistics: Unpaired student’s t test (E, F).

