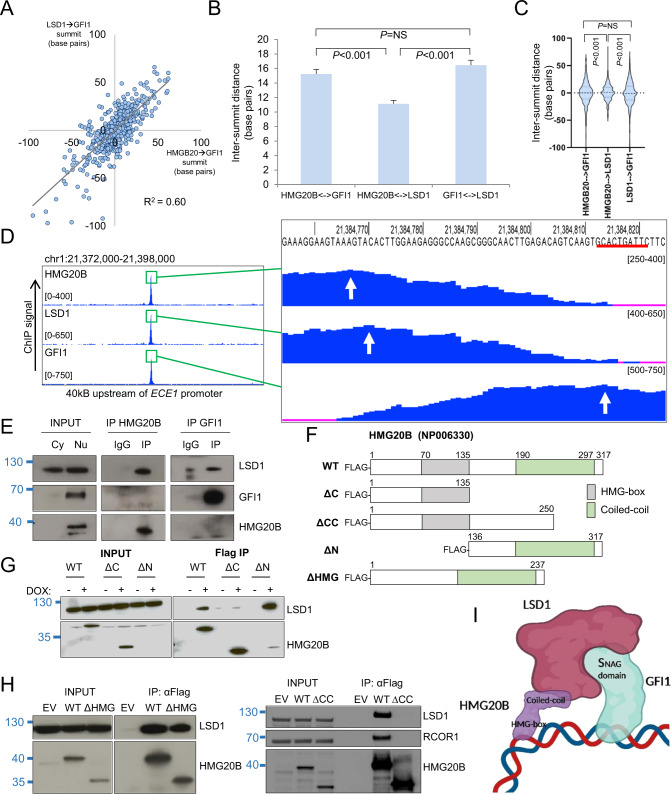
Fig. 3. Co-localization pattern of HMG20B, LSD1 and GFI1 on chromatin.
A Dot plot show base pair distances between the absolute summits of HMG20B and GFI1 binding peaks (with pileup value ≥300) versus base pair distances between the absolute summits of LSD1 and GFI1 binding peaks. B Bar graph shows mean+SEM intersummit base pair distances between the indicated factor binding peaks. C Violin plots show distribution, median (thick dotted line), and interquartile range (light dotted lines) for intersummit base pair distances between the indicated factor binding peaks. D Exemplar ChIPseq tracks. Red line indicates GFI1 binding motif. White arrows indicate called peak summits. E Western shows nuclear immunoprecipitation for the indicated proteins in THP1 AML cells. Cy cytoplasmic, Nu nuclear. F HMG20B constructs. WT wild type. G, H Westerns show doxycycline-induced (DOX) expression of HMG20B constructs and αFlag immunoprecipitations in THP1 AML cells. I Proposed model of chromatin binding (created with BioRender). For B and C, one-way ANOVA with Tukey post hoc test was used to determine statistical significance.

