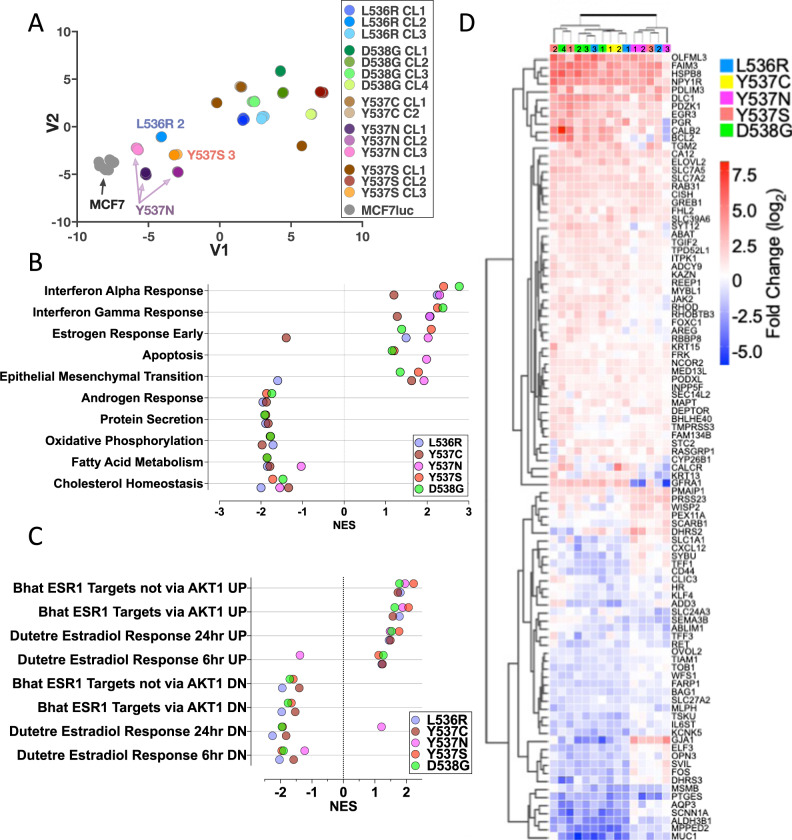
Fig. 3. RNA-sequencing reveals gene expression patterns in ESR1 mutant cells.
A Relationships between gene expression patterns in ESR1 mutant lines were visualised using a t-SNE plot. B Gene Set Enrichment Analysis (GSEA) was performed for each mutation. The top 10 enriched GSEA hallmark gene sets are shown. Filled circles represent the normalised enrichment score (NES) for each mutation (FDR q-value <0.25). C Shown is GSEA analysis undertaken using the C2 curated MSigBD for gene sets that are involved in estrogen signalling, excluding gene sets containing less than 80 genes (FDR q-value <0.25). D Heatmap shows genes within the hallmark gene sets “estrogen response early” and “estrogen response late”, which are differentially regulated in all mutations compared to MCF7, with the following cut-off: −0.5 > log2FC > 0.5. The individual clones for each ESR1 mutation are denoted with the coloured, numbered boxes at the top of the heatmap.

