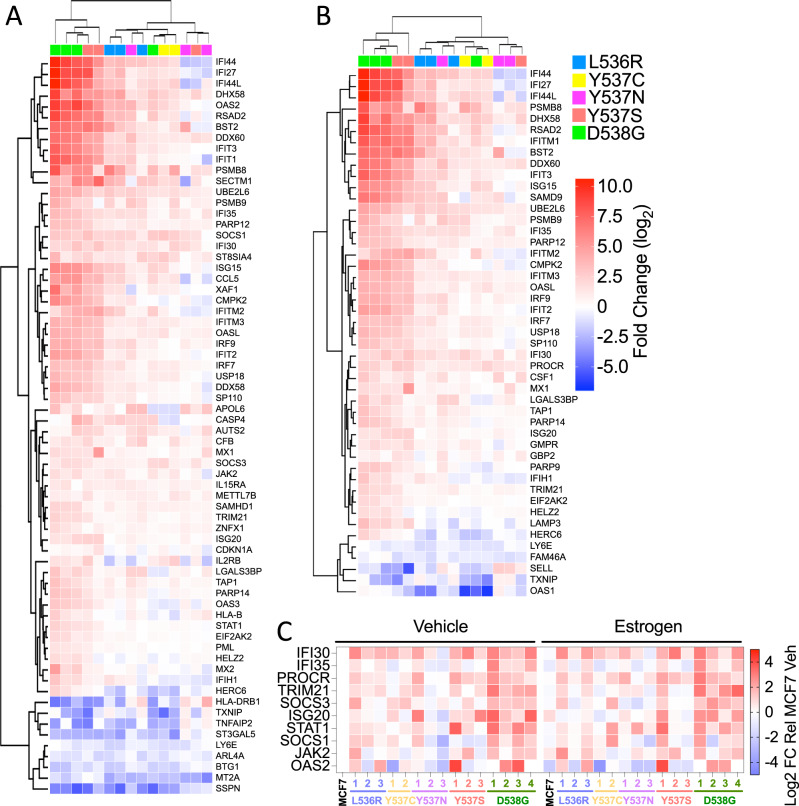
Fig. 4. Genes associated with interferon response pathways are enriched in ESR1 mutant cells.
A, B The heatmaps show genes within the hallmark gene sets “interferon alpha response” and “interferon gamma response”, which are differentially regulated in all mutations compared to MCF7 (cut-off: −0.5 > log2FC > 0.5). C RT-qPCR was performed using RNAs described in Fig. 1C. The heat map shows mean expression relative to expression in estrogen-free MCF7 cells (the data summarised in the heat map are plotted in Supplementary Fig. 9).

