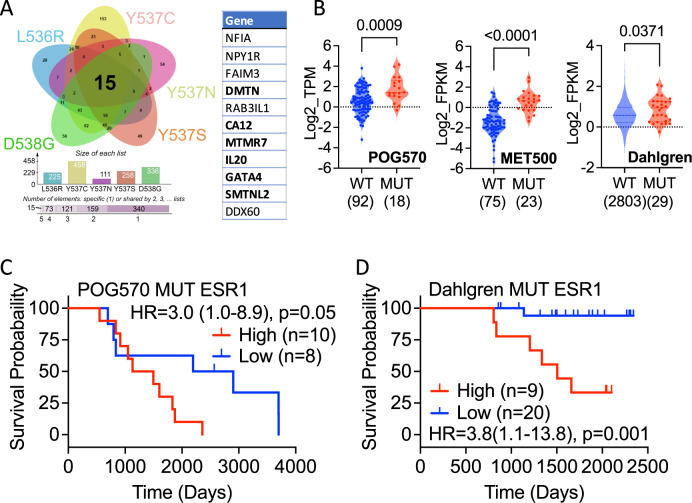
Fig. 5. Identification of differential genes for all ESR1 mutants.
A DEGs that show increased (log2FC > 1 and padj <0.05) expression in every clone for each ESR1 mutation were overlapped in the Venn diagram. The 11 genes used in signature development are listed. The 6 genes developed from analysis of the POG570 mutant ESR1 cancers are highlighted in bold. B Expression of the 6-gene list is elevated in ESR1 mutant metastatic (POG570, MET500) and primary (Dahlgren) breast cancer. The number of ER + patients with WT and mutant ESR1 are shown in parentheses. The Mann-Whitney test was used for significance determination. C, D Kaplan–Meier plots of survival for ER + breast cancer patients with ESR1 mutations. The hazard ratios (HR), together with 95% confidence intervals (in brackets) and p value from the log rank test is shown in each panel; ‘n’ is the number of samples in each group.

