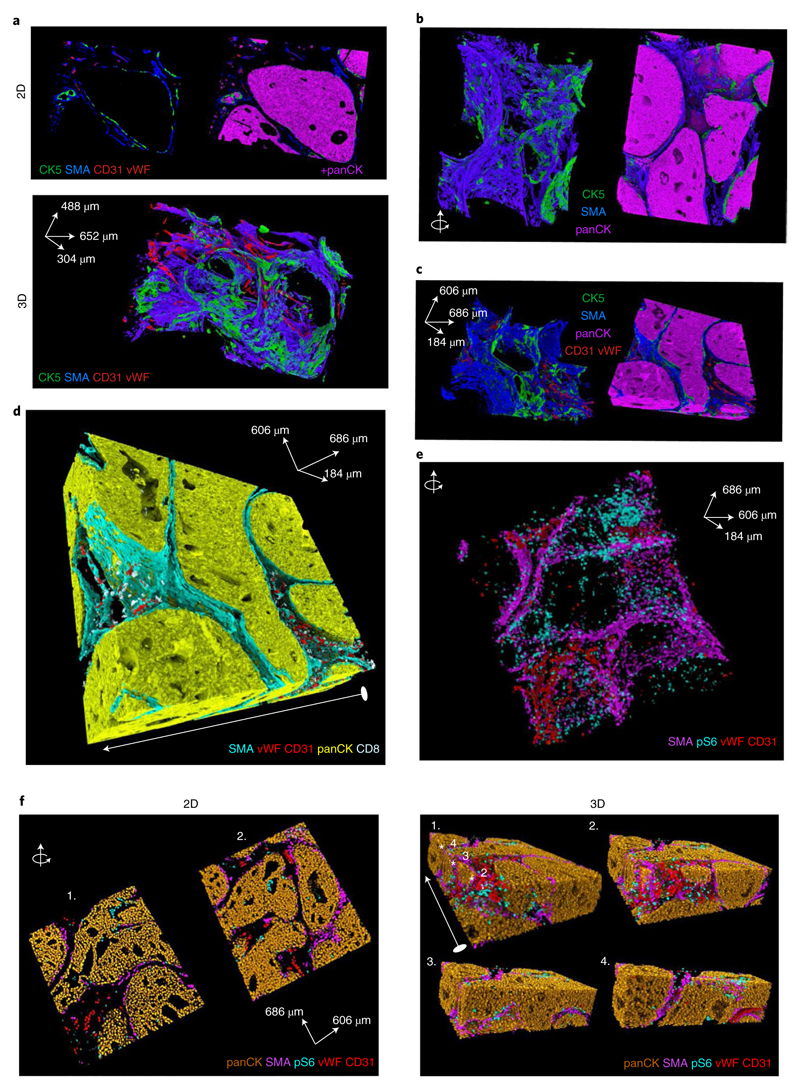
Fig. 5. 3D reconstructions reveal cellular and environmental relationships in tissues.
a, Raw data rendering in 2D and 3D of a tumor basal layer, showing expression of basal markers CK5 and SMA, and endothelial markers vWF and CD31 in one out of the two breast carcinoma 3D IMC models used in this study. The 2D slice is representative of 152 slices; the 3D rendering uses all of the 152 slices. The image has the same angle as images in Fig. 3b–d. b, Alternative angle of the same model showing raw data rendering of the indicated markers. c, Raw data voxel rendering of the second breast cancer 3D IMC model showing SMA, vWF, CD31, panCK and CD8a marker distributions. The white arrow indicates the angle of the model displayed on d and e. d, Raw data voxel renderings of the same breast carcinoma 3D IMC model as in c showing SMA, panCK, vWF, CD31, and CK5 marker distributions. e,f, Single-cell expression for the indicated markers in the same breast carcinoma model shown in c. Each voxel for every cell is assigned an expression value for each marker. Two representative 2D slices (out of 92) from the breast carcinoma model imaged in c and d, showing single-cell level expression for the indicated markers (f, left). Single-cell expression for panCK, SMA, vWF, CD31 and pS6 shown in a full 3D model for the breast carcinoma model analyzed in e and f1 and displayed through the z-dimensions cut at different x-planes of the model2–4 (f, right). The white arrow indicates the direction along which the model was cut and the white stars indicate the positions of the cuts. AGAVE 1.0.0.1 was used for 3D rendering of the data.

