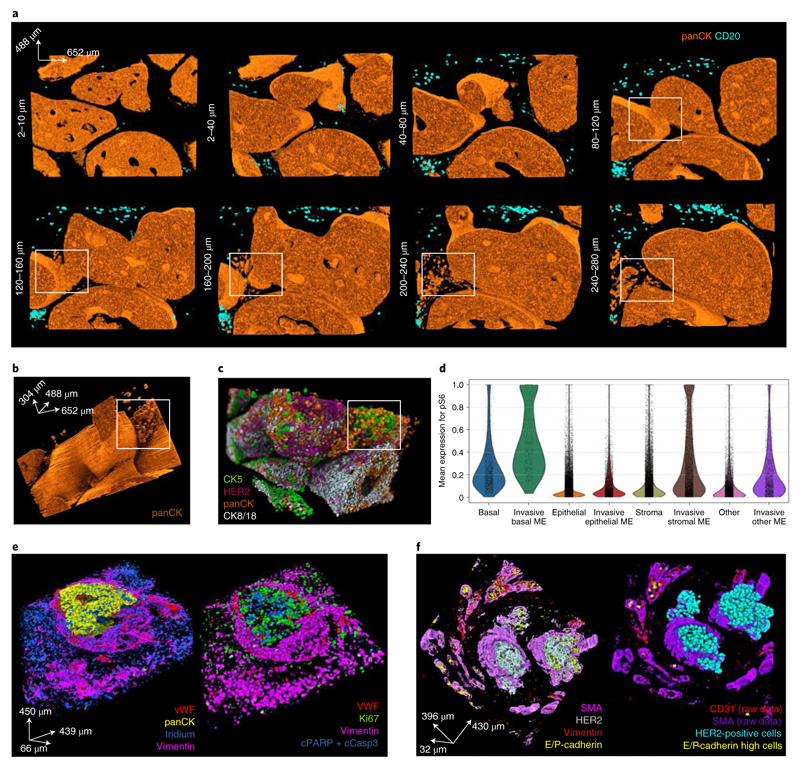
Fig. 6. 3D IMC reveals potential invasion-associated phenomena.
a, A series of raw voxel data 3D renderings of ~40 μm stacks (20 slices) for panCK and CD20 from the breast carcinoma 3D IMC model that captured putative invasive cells (same model as displayed in Fig. 1). The white rectangle marks a protrusion in the surface of a ductal carcinoma in situ-like structure at 120 μm depth and marks tumor clusters at the same location. b, Full 3D raw data voxel rendering of panCK from the same model as a. The tumor cell clusters are shown within a white rectangle. c, Single-cell marker expression levels for CK5, panCK, HER2 and CK8/18 visualized by rendering over the 3D mask. Marker expression data for each cell was calculated as the mean intensity of ion counts over the object mask. d, A violin plot for pS6 expression levels in epithelial, basal and stromal cells in the immediate microenvironment (ME) of invasive cells and in cells of the same type in the whole tissue. ME was defined as cells that are within 50-μm radius from any of the putative invasive cells. e, A rendering of a raw data 3D IMC voxel model from one out of two pathologist-identified samples of lymphovascular invasion taken from the periphery of a breast tumors (left). Single-cell marker expression for the same model where each voxel for every cell is assigned its marker expression value for the indicated markers, including proliferating tumor cells (Ki-67) and apoptotic cells (positive for cleaved PARP and cleaved caspase 3) (right). f, Raw data 3D IMC voxel model of a pathologist-identified sample of lymphovascular invasion from a different breast tumor, out of the two such samples used in this study (left). Single-cell marker expression for the same model showing HER2+ tumor cells inside a lymph vessel in the center of the image and single E-cadherin+ cells inside blood vessels at the periphery of the image (right). AGAVE 1.0.0.1 was used for 3D rendering of the data.

