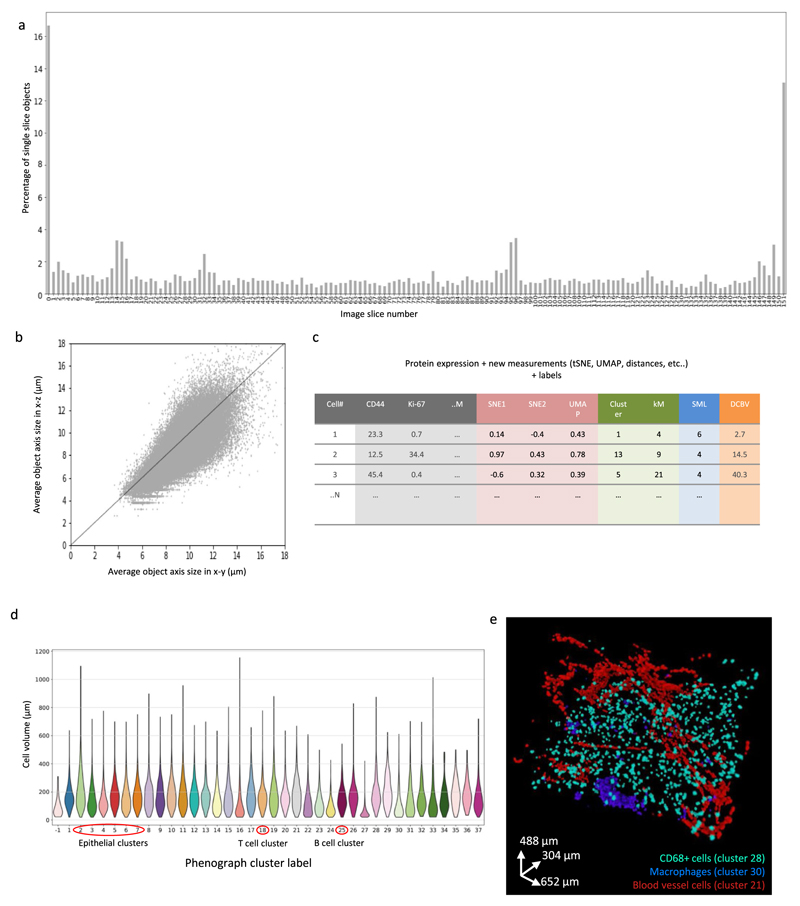
Extended Data Fig. 3. Evaluation of the 3D single cell segmentation for a breast carcinoma 3D IMC model.
All panels show data from the same breast carcinoma sample shown in Figs. 1 and 2. (a) Percentage of objects occurring only on one slice for the full 152-slice stack after 3D segmentation to evaluate if the final cell masks were affected by the intensity variation between the consecutive slices. (b) Average axis length for each segmented object in x-y plane and in y-z plane. The z axis was calculated with 2-μm resolution. Axis length was calculated as the averages of minor and major axes using skimage.mesure.regionprops function37. (c) Schematic showing the application of multiple methods to augment and annotate the catalog (N cells, M channels). The data table includes cluster identifiers and dimensionality reduction coordinates. Topographic information such as distance to a particular structure can be calculated by combining the 3D mask with other calculated masks, for instance, the distance to closest blood vessel. (d) Cell volumes calculated as total number of voxels for each segmented object for each cell cluster identified by Phenograph. (e) Distribution of CD68 + clusters with cluster 28 in green and cluster 30 in blue, and cluster 21 in red (endothelial cells). AGAVE 1.0.0.1 was used for 3D rendering of the data.

