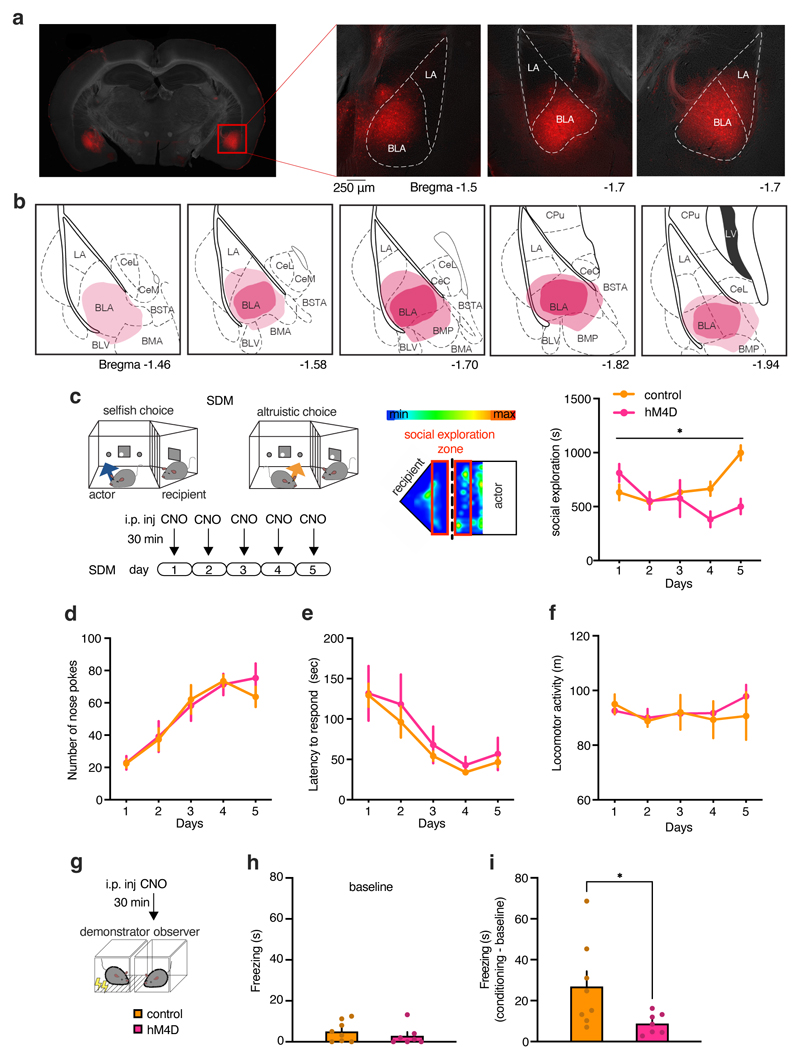
Extended Data Figure 6. Behavioral effects of BLA neuronal silencing.
a, Representative images of viral expression in the BLA after injection with AAV-CamKIIa-hM4D-mCherry (data from 3 independent experiments). b, Reconstruction of viral expression. Red areas represent viral expression (higher expression = darker color). c, Left, schematic illustration of the actor-recipient testing chambers with graphical representation of the amount of time mice spent in different parts of the chambers (with blue as the shortest and red as the longest time). Right, social exploration, was measured in the area highlighted in red, in control (n=10) and hM4D (n=7) mice towards their recipients during the SDM task (two-way ANOVA, group (control, hM4D), F(4, 60)=5.0, p=0.0013). d, Number of nose pokes in control (n=9) and hM4D (n=10) mice (two-way ANOVA, group (control, hM4D), F(1, 13)=0.54, p=0.4721), e, Latency to respond in control (n=8) and hM4D (n=9) mice (two-way ANOVA, group (control, hM4D), F(1, 11)=0.02, p=0.877), and f, Locomotor activity (two-way ANOVA, group (control, hM4D), F(1, 11)=0.10, p=0.7566), during the five days of testing in the SDM task in control (n=6) and hM4D (n=7) mice. g, Observers mice received intraperitoneal (i.p.) injection of CNO (3 mg/kg) and after 30 minutes were tested with their respective demonstrators on the observational fear learning paradigm. h-i, Freezing behavior displayed by actor mice, control (n=8) and hM4D (n=7), during baseline (h, two-tailed unpaired t-test: t=0.83, d.f.=13, p=0.4170) and conditioning phases of the test (i, two-tailed unpaired t-test: t=2.22, d.f.=13, p=0.0447). *p<0.05. Values are expressed as mean ± s.e.m.

