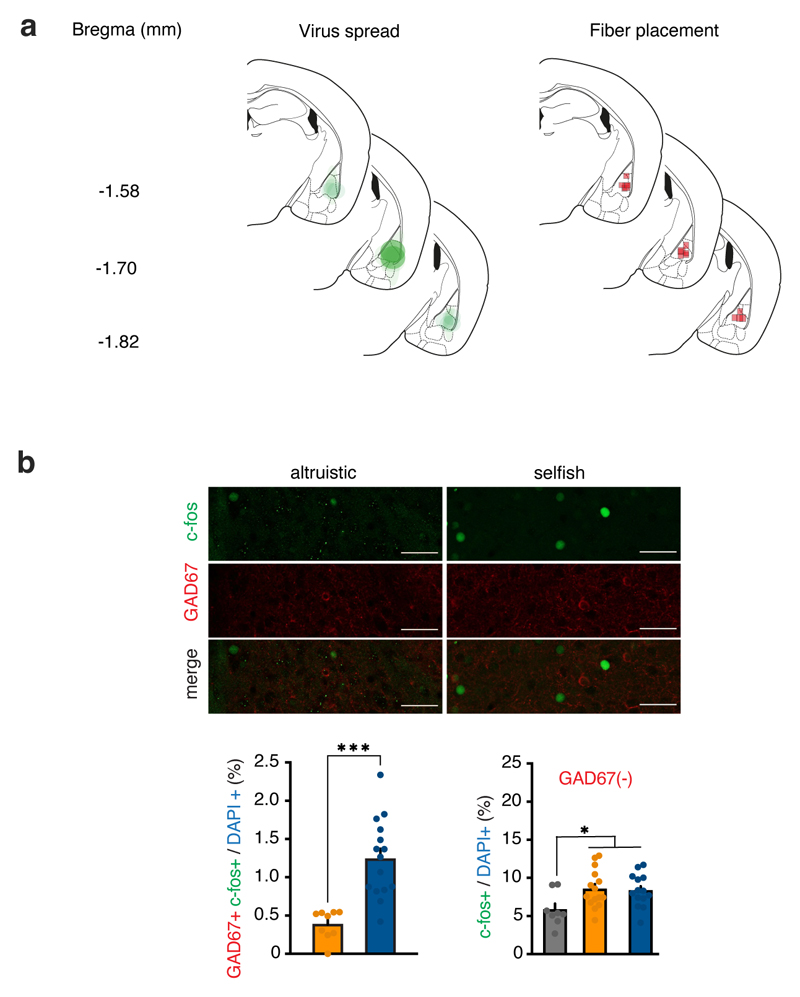
Extended Data Figure 8. Fiber photometry and c-fos expression in the BLA.
a, Targeting maps of GCaMP6f expression and location of optic fibers in the BLA for fiber photometry recordings. b, Top, representative images of c-fos (green) and GAD67 (red) expression. Scale bar (applicable to all micrographs), 50 μm. Bottom, bar graph quantification of c-fos GAD67 double positive cells in altruistic and selfish mice (n=21 sections from 5 animals; two-tailed unpaired t-test: t=3.33, d.f.=22, p=0.0030) and bar graph quantification of cells that were c-fos positive and GAD67 negative in altruistic and selfish mice and mice without recipient (n=37 sections from 7 animals; one-way ANOVA, F(2, 34)=3.97, p=0.0282). *p<0.05, ***p<0.001. Values are expressed as mean ± s.e.m.

