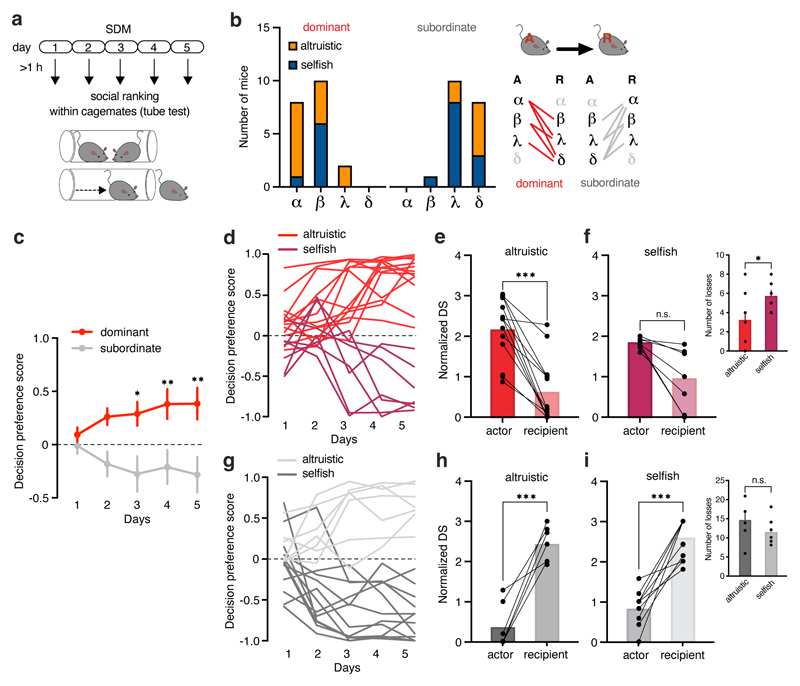
Figure 4. Social dominance hierarchy modulates preference for altruistic choices.
a, After SDM daily session mice were tested on the tube test (at least 1h after SDM), to measure the hierarchical relationship of animals within the same cage. Actor and recipient mice were tested pairwise and using a round robin design. b, Number of altruistic or selfish actor mice (A) that were dominant (red) or subordinate (grey) compared to the recipient (R) in the tube test (n=39). c, Decision preference score of actor mice that were dominant or subordinate in the tube test compared to their recipient (two-way ANOVA, F(4, 148)=3.46, p=0.097; dominant n=20, subordinate n=19). d, Individual decision preference score in the SDM of dominant actor mice grouped by altruistic or selfish preference (n=20). e-f, Social dominance (normalized David’s score) quantified based on the number and directionality of interactions in the tube test in actor mice that were dominant compared to their recipient, grouped by (e) altruistic (two-tailed paired t-test, t=5.01, d.f.=23,97, p<0.0001; n=13 pairs) and (f) selfish preference (two-tailed paired t-test t=2.27, d.f.=6,87, p=0.0576; n=7 pairs). Inset, number of losses by dominant altruistic and selfish actor mice in the tube test (two-tailed paired t-test, t=2.45, d.f.=18, p=0.0244). g, Individual decision preference score in the SDM of dominant actor mice grouped by altruistic or selfish preference (n=19). h-i, Normalized David’s score in actor mice that were subordinate compared to their recipient, grouped by (h) altruistic (two-tailed paired t-test, t=7.66, d.f.=11,39, p<0.0001; n=7 pairs) and (i) selfish preference (two-tailed paired t-test, t=8.6, d.f.=21,67, p<0.0001; n=12 pairs). Inset, number of losses by subordinate altruistic and selfish actor mice in the tube test (two-tailed paired t-test, t=1.65, d.f.=17, p=0.1154). *p<0.05, **p<0.01, ***p<0.001. n.s. not significant. Values are expressed as mean ± s.e.m.

