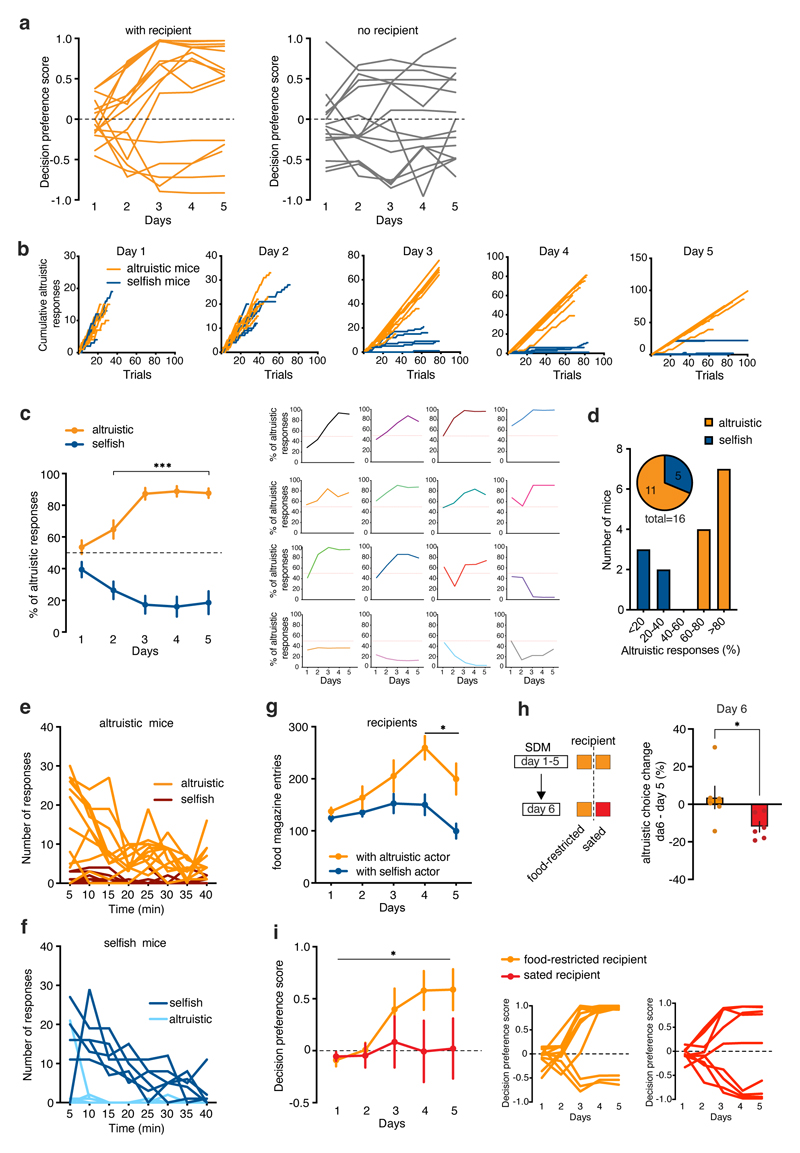
Extended Data Figure 1. Characterization of behaviors in the SDM task.
a, Individual decision preference scores in mice tested with (orange) or without (grey) recipient mouse over the five days of SDM task. b, Cumulative number of altruistic choices for each mouse (altruistic, orange; selfish, blue) during each daily session in the SDM task. c, Altruistic responses (in %) in altruistic (n=11) and selfish (n=5) mice (two-way RM ANOVA, group (altruistic, selfish) x time (days 1-5), F(4, 56)=21.55, p<0.0001) and individual scores of altruistic responses across five days of SDM. d, Number of tested mice grouped by percentage of altruistic responses. e, Number of choices (orange, altruistic; maroon, selfish) of altruistic mice on the last session of training in the SDM task (two-way RM ANOVA, choice (altruistic, selfish) x time (minutes), F(7, 70)=5.67, p<0.0001). f, Number of choices (light blue, altruistic; blue, selfish) of selfish mice on the last session of training in the SDM task (two-way RM ANOVA, choice (altruistic, selfish) x time (minutes), F(7, 35)=2.61, p=0.0276). g, Number of head entries in the food magazine of recipient mice tested with altruistic (orange, n=14) or selfish (blue, n=14) actors (two-way RM ANOVA, group (altruistic, selfish) x time (days 1-5), F(4, 103)=3.04, p=0.0203). h, Following training in the SDM task actor mice were tested in an additional session with sated (red, n=6) or food-restricted (orange, n=6) recipient mice (two-tailed unpaired t-test: t=2.37, d.f.=10, p=0.0387). i, Left, decision preference score in mice tested with food-restricted (orange, n=12) or sated (red, n=9) recipient mice over the five days of SDM task (two-way RM ANOVA, group (sated, food-restricted) x time (days 1-5), F(4, 76)=2.62, p=0.0409). Right, individual curves representing decision preference scores. *p<0.05, ***p<0.001. Values are expressed as mean ± s.e.m.

