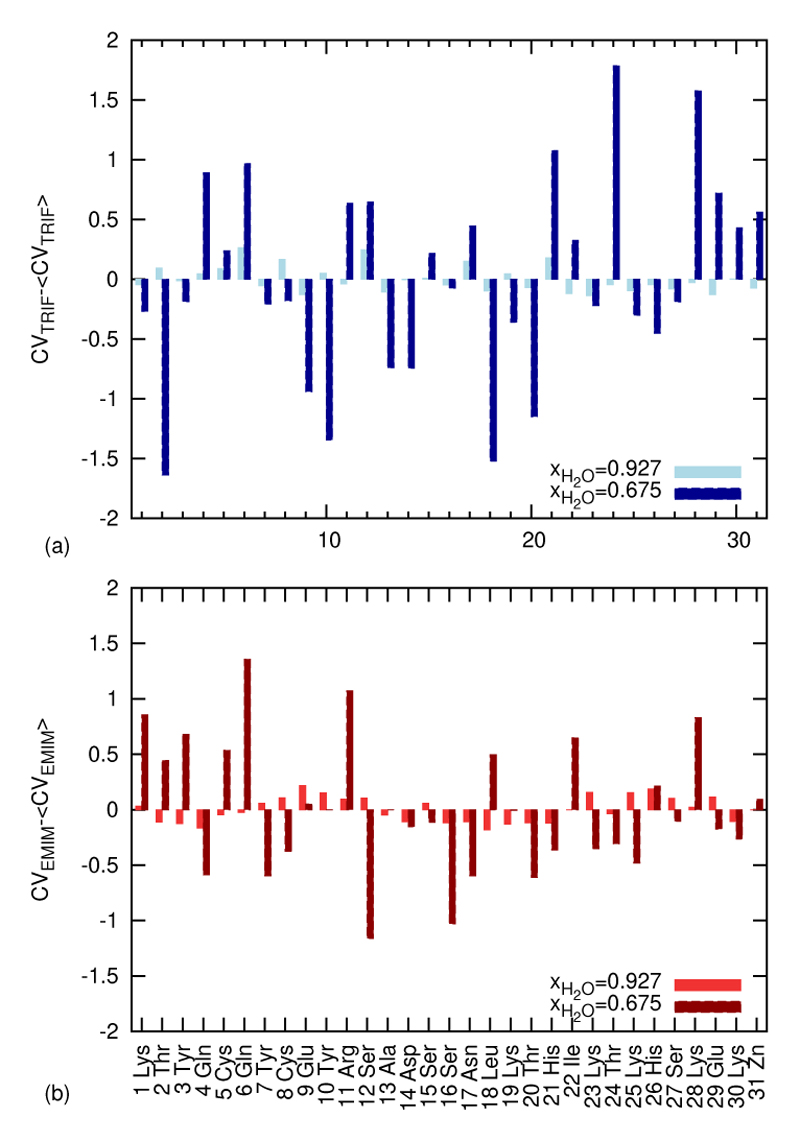
Figure 11.
(a) The entries of the contact matrix lie within the interval [0,1] and are mapped onto a greyscale. They are given for the amino acids of the protein and 50 EMIM+ molecules (residues). (b) The entries of each row of the contact matrix are summed, mapped onto a greyscale and given as a column, a contact vector. The intensity of each component displays the frequency of Voronoi contacts between an amino acid-residue and a solvent-species.

