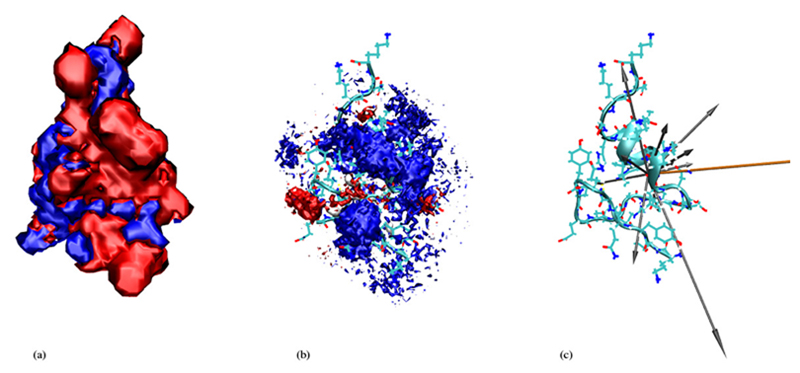
Figure 6. Front view for xH2O = 0.927.
(a) The blue isosurface represents -0.5kcal/mole, the red one +0.5kcal/mole. (b) Cations are represented by red, anions by blue and water molecules by gray clouds. (c) Structure of 5ZNF and secondary structure as a ribbon diagram, as well as the dipole vectors for charged amino acids (in grey) and for the total protein 5ZNF (in orange). The 3D density in figure (b) is sampled from the entire trajectory, figures (a) and (c) represent snapshots of the protein.

