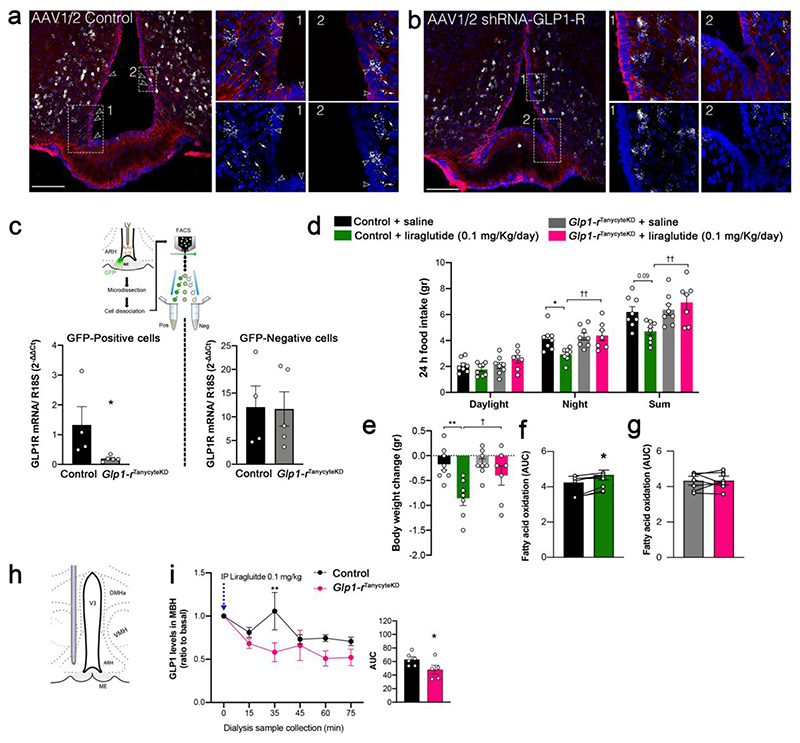
Figure 4. Knocking down GLP1R in tanycytes abolishes both the shuttling of blood-borne liraglutide into the hypothalamus and its anti-obesity effects.
(a, b) Representative photomicrographs of the tuberal region of the hypothalamus showing vimentin-immunoreactive tanycytic processes and cell bodies (red) and GLP1R mRNA expression (white dots) after transduction of tanycytes with a control AAV1/2 (a) or an AAV1/2 expressing GLP1R shRNA (b). Empty arrowheads indicate tanycytic cell bodies expressing GLP1R in the vmARH and white arrows point to tanycytic processes where vimentin and Glp1-r transcripts are colocalized. Scale bar: 200 μm. (c) Schematic diagram: sorting of GFP-positive putative tanycytes following AAV1/2 control or AAV1/2 shRNA-GLP1R infusion into the lateral ventricle. Bar graph: expression of GLP1R mRNA in GFP-positive and -negative FACS-sorted cells. Unpaired one-tailed t-test (positive cells; control vs. GLP1RtanycteKD, t(7) = 2.08, p = 0.0377, n = 4, 5 mice). (d) Cumulative food intake during the different light/dark phases 3 days after liraglutide treatment, compared to baseline (Night: two-way ANOVA, genotype: F(1, 27)= 7.88, p = 0.009; treatment: F(1, 27) = 3.59, p = 0.069; interaction: F(1, 27)= 4.72, p = 0.039. Tukey’s post hoc test, control saline vs. control liraglutide, p = 0.033 and Glp1-rTanycyteKD saline vs. Glp1-rTanycyteKD liraglutide, p = 0.99; control liraglutide vs. Glp1-rTanycyteKD liraglutide, p = 0.042. Sum: two-way ANOVA, genotype: F(1, 27)= 7.64, p = 0.010; treatment: F(1, 27)= 1.12 , p = 0.299; interaction: F(1, 27)= 5.48, p = 0.027. Tukey’s post hoc test, control saline vs. control liraglutide, p = 0.09 and Glp1-rTanycyteKD saline vs. Glp1-rTanycyteKD liraglutide, p = 0.809; control liraglutide vs. Glp1-rTanycyteKD liraglutide, p = 0.007; n = 8, 8, 8, 7 mice). (e) Body weight change after the experiment (two-way ANOVA, genotype: F(1, 26)= 3.07, p = 0.091; treatment: F(1, 26)= 11.48 , p = 0.0022 interaction: F(1, 26)= 2.47, p = 0.128. Tukey’s post hoc test, control saline vs. control liraglutide, p = 0.0017and Glp1-rTanycyteKD saline vs. Glp1-rTanycyteKD liraglutide, p = 0.210; control liraglutide vs. Glp1-rTanycyteKD liraglutide, p = 0.031, n = 8, 7, 8, 7 mice). (f, g) AUC of 24h fatty acid oxidation in control (f) and Glp1rtanycyteKD (g) animals 3 days after liraglutide injection, compared to saline (n = 8 mice per group). Paired two-tailed t-test t(6) = 3.62, p=0.011 in f (n = 7 mice) and t(6) = 0.02, p = 0.972 in g (n = 8 mice). (h) Schematic diagram illustrating the implantation of the microdialysis probe in the mediobasal hypothalamus. (i) GLP1 concentrations in the ARH interstitial liquid collected by microdialysis every 15 minutes following i.p. liraglutide (t0 min) injection (0.1 mg/kg) in control (n = 6) and GLP1RtanKO mice (n = 5). Two-way ANOVA followed by a Bonferroni post hoc test, p=0.0088. AUC, one-tailed t-test, t(9) = 2.10, p = 0.0323. Data are expressed as means ± SEM. *p < 0.05; ** p < 0.01, control saline vs. control liraglutide and control vs. Glp1rtanycyteKD;; † p < 0.05 control liraglutide vs. Glp1rtanycyteKD liraglutide.

