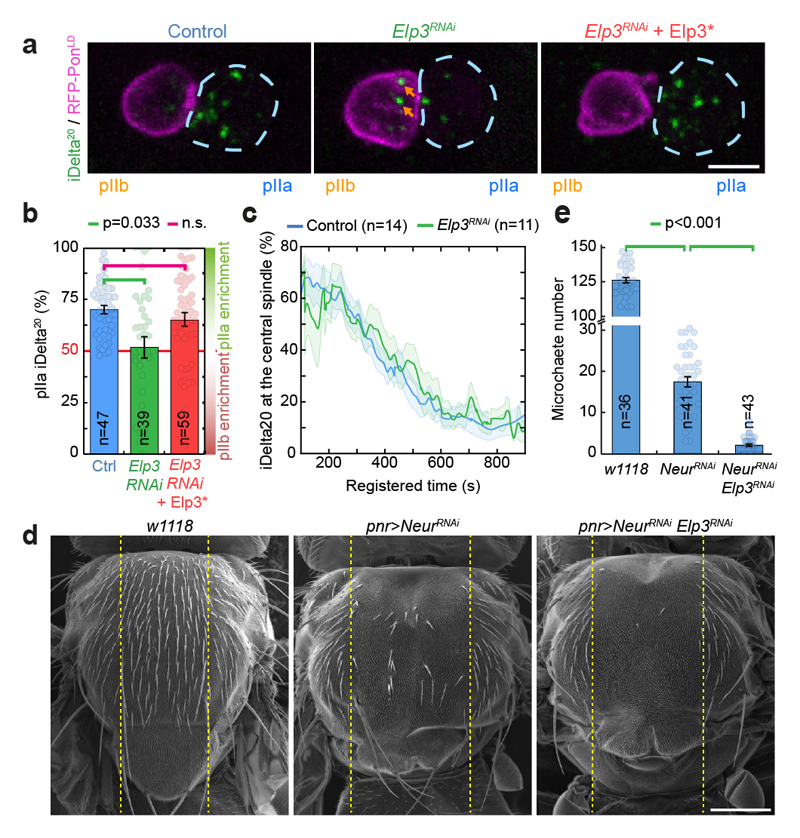
Figure 2. Elongator controls asymmetric Sara endosome segregation and thereby contributes to Notch signalling.
(a) Dividing SOP showing Sara endosomes (iDelta20) and mRFP-Pon (pIIa cortex; dashed blue) at the end of cytokinesis. Image corresponds to Maximum intensity z-projection of entire cells (SDCM). Note the endosomes in the pIIb daughter cell upon Elongator depletion (arrows). (b) Percentage of iDelta20 in pIIa after abscission in SOPs (mean ± SEM; Statistics: one-way ANOVA, followed by a Tukey post-hoc test (p value=0.033); n: number of SOPs analysed). (c) Dynamics of Sara endosomes at the central spindle, mean ± SEM (shaded area). Time is automatically registered between movies (for registration, see methods). Registered t=0 seconds: anaphase B onset. Note that the fraction of total endosomes at the spindle at t=100s is similar between control and Elp3RNAi, and that the kinetics of departure are the same. (d-e) Scanning EM (d) and microchaete numbers in the central of the notum (panier region, dashed lines in d) in Elp3RNAi/NeurRNAi mutants (e). Mean±SEM. Statistics: Kruskal-Wallis non-parametric ANOVA1 test. post-hoc test P-values indicated. Scale bars: 5 μm (a); 200 μm (d). Source numerical data available in source data.

