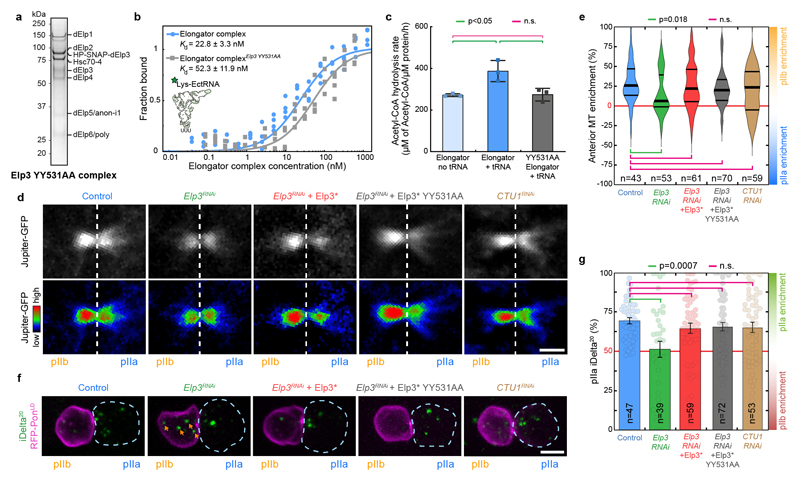
Figure 4. The enzymatic activity of Elp3 is not required for Elongator effects on the central spindle.
(a) Coomassie-stained gradient SDS-PAGE gel of Elongator YY531AA mutant complex purified using a His-PC-SNAP-tagged Elp3 subunit after two steps of purification (PC affinity then sucrose gradient). (b,c) Biochemical characterization of the YY531AA Elongator complex. (b) Measurement of the affinity of the direct interaction between purified His-PC-Elp3 Elongator and tRNALys measured by MST (see methods). (c) Measurements of the tRNA modification activity of Elongator (mean ± SD, see methods). The YY531AA mutant of Elongator binds to tRNA with a similar affinity compared to WT Elongator, but is unable to modify tRNA. Note that the control curves are identical to the ones shown in Extended Data Fig. 5f,g. n=3 independent experiments. Statistics: one-way ANOVA followed by a Tukey multiple comparison test (p value indicated). (d) Dividing SOP showing Jupiter-GFP (top row) or Jupiter-GFP with the Rainbow RGB LUT applied (bottom row). Image corresponds to maximum intensity z-projection of the central spindle (SDCM). (e) Enrichment in pIIb. Thick line: median; thin line: quartile; n: number of central spindles analysed. Statistics: Kruskal-Wallis non-parametric ANOVA1 test. P-values of the respective post-hoc tests are indicated. Note that the control, Elp3 RNAi and Elp3 RNAi + Elp3* datasets are the same as the ones presented in Fig. 1d, shown here for convenience. (f) Dividing SOP showing Sara endosomes (iDelta20) and mRFP-Pon (pIIa cortex; dashed blue). Image corresponds to Maximum intensity z-projection of entire cells (SDCM). Note the endosomes in the pIIb daughter cell upon Elongator depletion (arrows). (g) Percentage of iDelta20 in pIIa after abscission in SOPs (mean ± SEM; Statistics: one-way ANOVA (P<0.0001), followed by a Tukey post-hoc test (p value indicated); n: number of SOPs analysed. Note that the control, Elp3 RNAi and Elp3 RNAi+Elp3* datasets are the same as the one presented in Fig. 2b, shown here for convenience). Expression of a RNAi-resistant version of Elp3 YY531AA is able to rescue the Elp3 RNAi phenotype on the central spindle and the asymmetric segregation of Sara endosomes. Scale bars: 2 μm (2); 5 μm (f). Source numerical data are available in source data.

