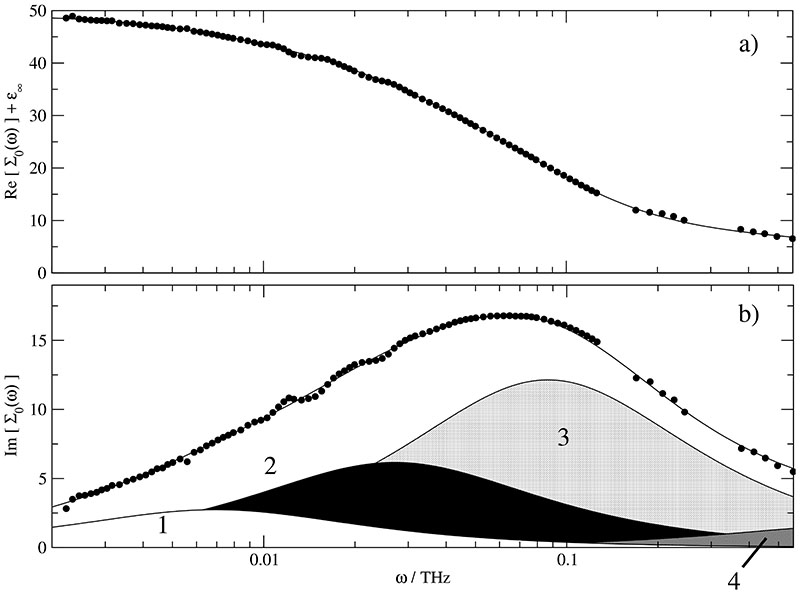
Fig. 1.
Experimental spectra (symbols) at xH2O=0.926 of (a) the total permittivity, Re[∑0(ω)] + ϵ∞ and (b) the total loss corrected for DC conductivity, Im[∑0(ω)], together with the spectra calculated with Eq. (25) from the parameters of Table II (lines). In (b) the contributions of the resolved Debye relaxations j = 1 … 4 are indicated.

