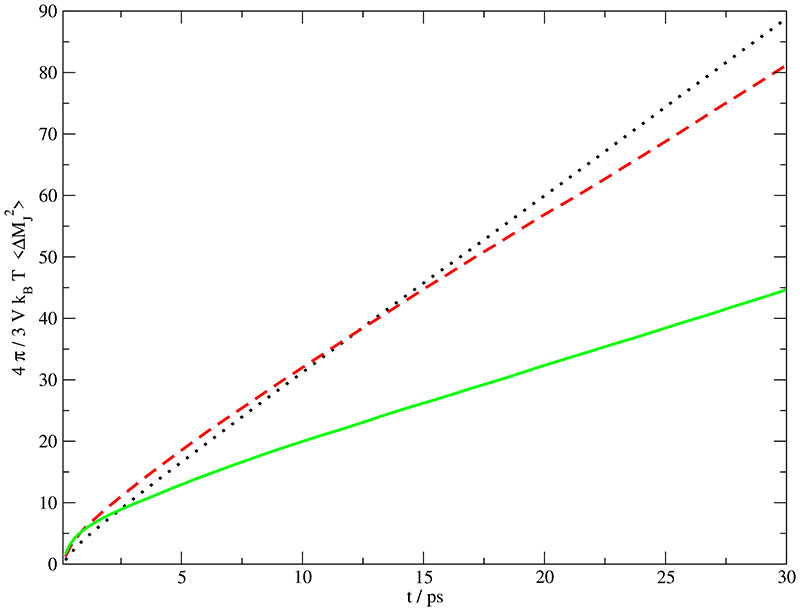
Fig. 5.
Einstein-Helfand plot of the mean squared displacement of the total translational dipole moment at various mole fractions: xH2O,sim = 0.768 (solid line), xH2O,sim = 0.912 (dashed line) and xH2O,sim = 0.967 (dotted line). ¿From the slopes of these curves the static conductivity σ(0) given in Table III is derived.

