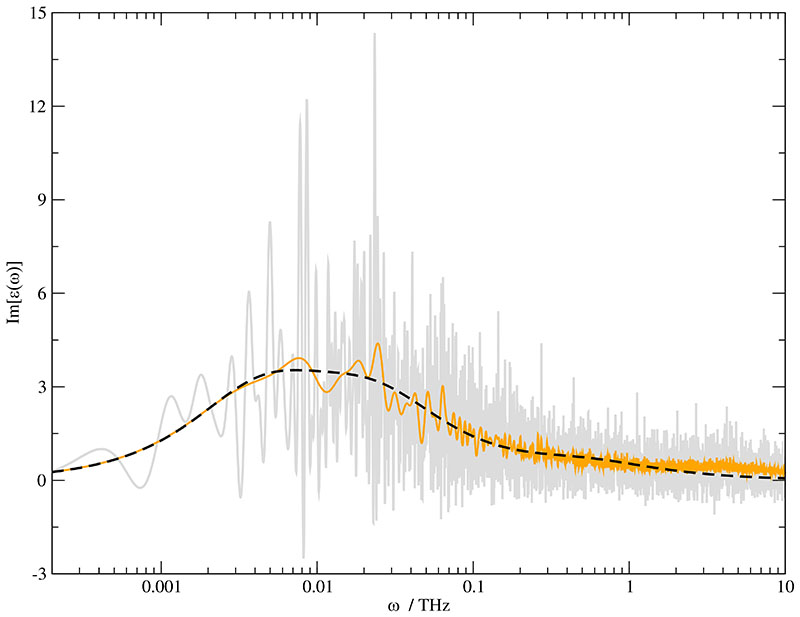
Fig. 3.
Im[ϵ(ω)] of the /water mixture with a water mole fraction xH2O =0.653. The gray line represents the spectrum of the pure data. The application of a chirp function with t0 = 1000 ps and τ =100 ps changes the spectrum to the orange solid line. The black dashed line represents the fit with three exponential functions with the parameter given in Table IV.

