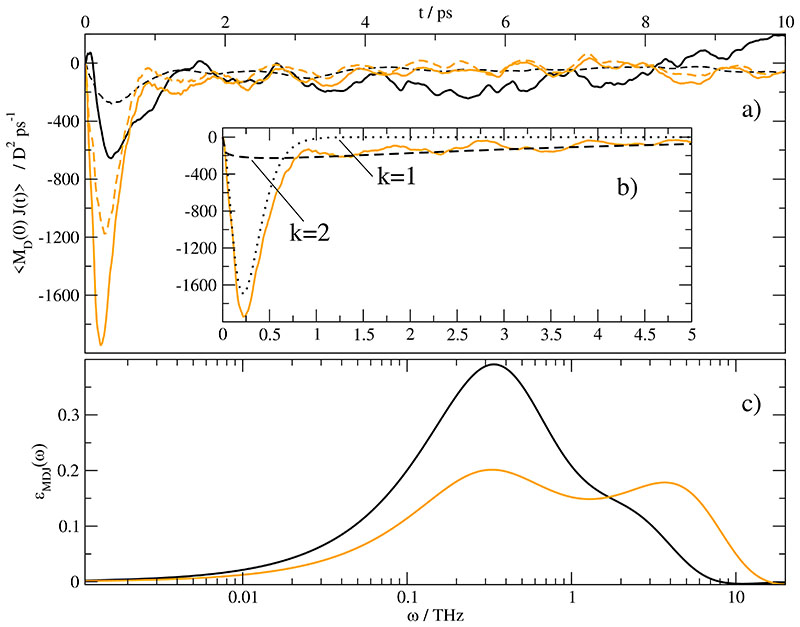
Fig. 7.
a) Cross-correlation 〈MD(0) · J(t)〉 of /water mixture with xH2O = 0.974 [black line] and xH2O = 0.643 [orange line]. The solid lines represent the correlation of the total collective rotational dipole moment MD (t) with the current J(t) whereas the dashed lines stand for the correlation of the ionic collective rotational dipole moment with the current J(t). b) Fit of 〈MD(0) · J(t)〉 of /water 2 at xH2O = 0.643 according to with the parameters given in Table VI. The orange line are the same data as a), the black dotted line and dashed line represent k = 1 and k = 2 contribution of f(t), respectively. The sum of both contributions is displayed as dash-dotted line. c) Contribution of the above mentioned cross-correlation 〈MD (0) · J(t〉 to the dielectric spectrum of ϵ(ω). Please note that this contribution is part of ϑ0(ω) additionally.

