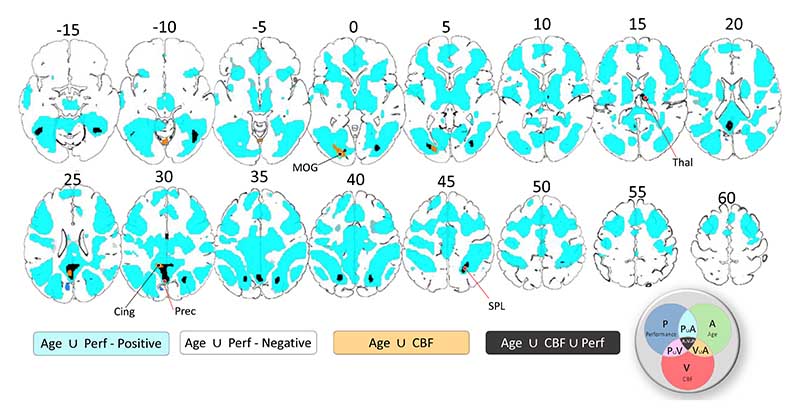
Figure 5.
Common Effects in commonality analysis. Positive and negative common effects between age and performance are shown in cyan and dark blue colours, respectively. Common effects between age and baseline CBF are shown in orange colour. Common effects between age, performance and CBF are shown in black colour. P – performance, A – age, V – vascular, CBF. Slices are numbered by z level in Montreal Neurological Institute (MNI) space.

