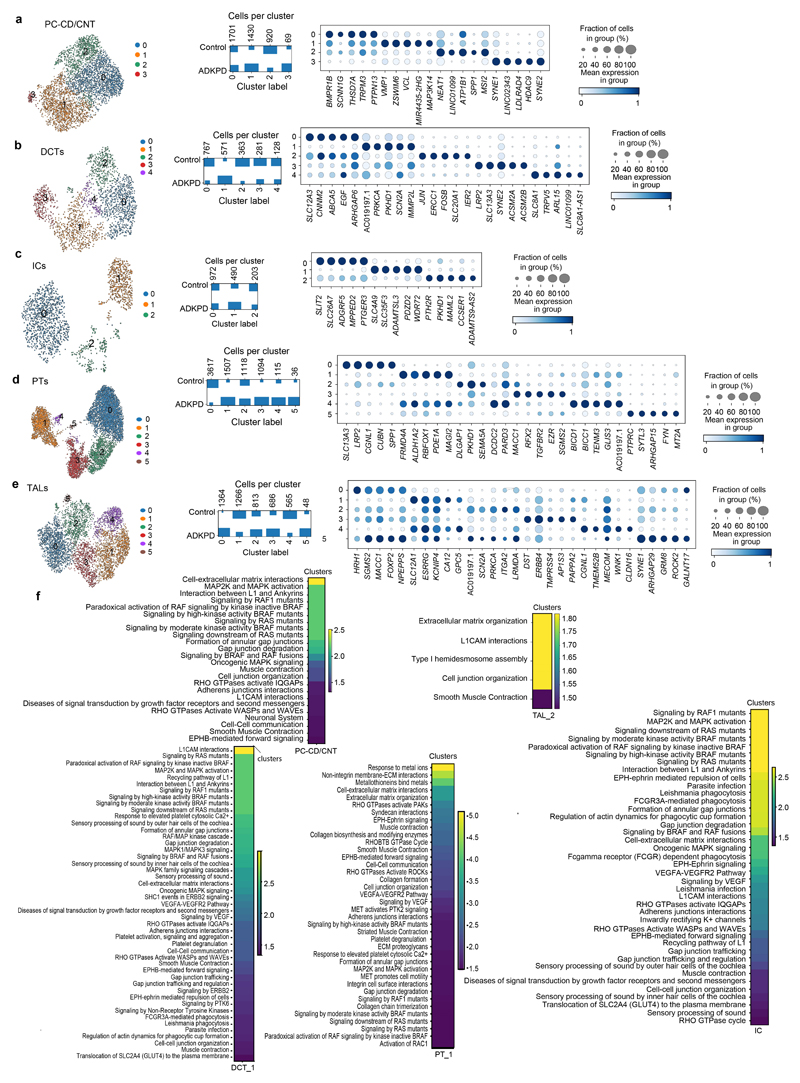
Extended Data Fig. 8. Subclustering analysis of selected populations in human ADPKD and control tissue snRNA-seq data.
a, Subclustering of principal cells of the collecting duct and epithelial cells of the connecting tubule (PC-CD/CNT), relative distribution of cells per subcluster in ADPKD and control tissue (donor biopsies) and top filtered marker genes of subclusters. b, Subclustering of cells from the distal convoluted tubule (DCT), relative distribution of cells per subcluster in ADPKD and control tissue (donor biopsies) and top filtered marker genes of subclusters. c, Subclustering of collecting duct intercalated cells (ICs), relative distribution of cells per subcluster in ADPKD and control tissue (donor biopsies) and top filtered marker genes of subclusters. d, Subclustering of proximal tubule epithelial cells (PTs), relative distribution of cells per subcluster in ADPKD and control tissue (donor biopsies) and top filtered marker genes of subclusters. e, Subclustering of cells from the Loop of Henle (LOH) thick ascending limb (TAL), relative distribution of cells per subcluster in ADPKD and control tissue (donor biopsies) and top filtered marker genes of subclusters. f, Overrepresentation analyses with Reactome pathway database using up-regulated DE genes obtained from ADPKD vs control comparison.

