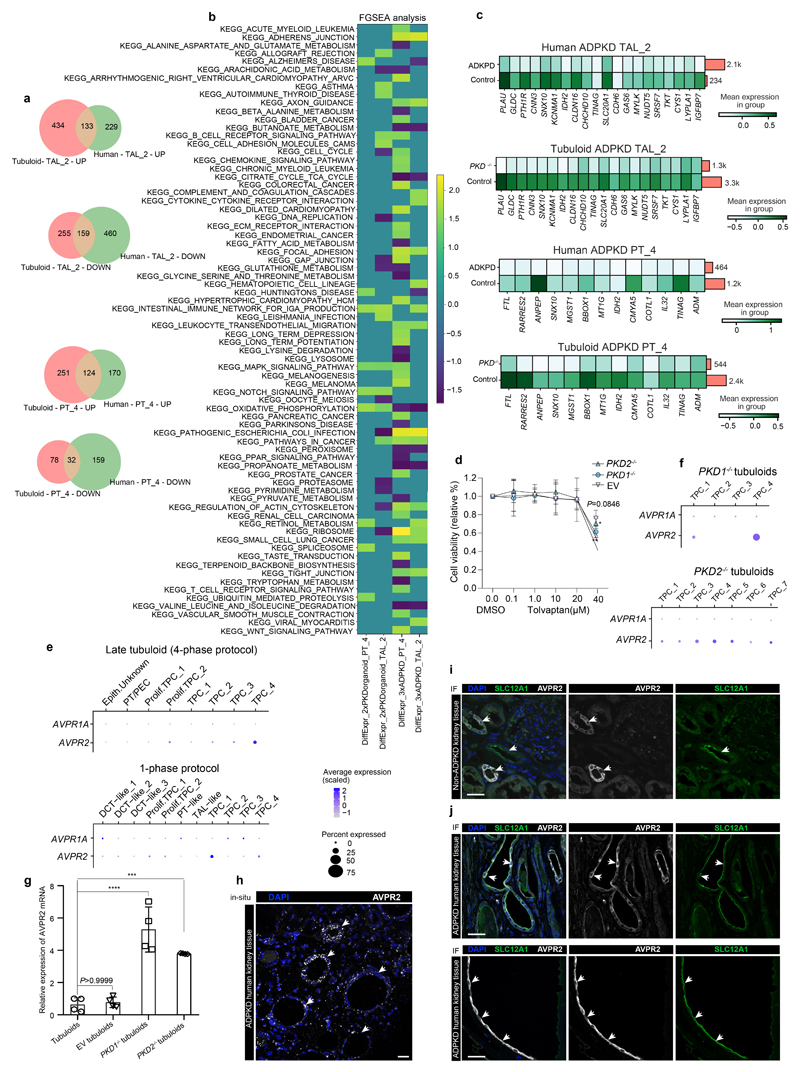
Extended Data Fig. 10. Gene expression in gene edited tubuloids as compared to human kidneys and AVPR2 expression in tubuloids.
a, Venn diagram of separately commonly up and downregulated genes in TAL cluster TAL_2 and PT_4 in human ADPKD kidney tissue versus healthy human kidney (donor biopsies) and the gene edited tubuloids as compared to control tubuloids. b, Commonly dysregulated pathways obtained from gene set enrichment with KEGG pathways using all differentially expressed (DE) genes in human ADPKD vs donor biopsies in PT-4 and TAL-2 cells with the cells of the tubuloids that mapped to PT-4 and TAL-2 using Symphony. c, Top selected commonly downregulated genes in human ADPKD vs donor biopsies and the cells that mapped to PT-4 and TAL-2 in PKD-/- vs Control. d, Results of the CellTiter-Glo 3D Cell Viability assay from control (EV), PKD1-/- and PKD2-/- tubuloids subjected to different doses of tolvaptan. 0.0 indicates 0.2% DMSO treated tubuloids as a control. 2-way ANOVA post-hoc Bonferroni in n = 3 mean ± s.e.m. No significant difference in cell viability for DMSO control (0.0 μM tolvaptan, 0.2% DMSO) compared to 0.1 to 20 μM tolvaptan treated EV tubuloids, PKD1-/-, PKD2-/- tubuloids, P >0.9999; 40 μM tolvaptan vs DMSO control, P = 0.0846 for EV tubuloids, **P = 0.0019 for PKD1-/- tubuloids, and *P = 0.0215 for PKD2-/- tubuloids. e-f, Dotplots of AVPR1A and AVPR2 average scaled mRNA expression in tubuloids (late and 1-phase protocol) (e) and PKD1-/- as well as PKD2-/- (f). g, Relative mRNA expression for AVPR2 (V2R) in non-treated tubuloids as compared to tubuloids transduced with a lentivirus control (EV) and tubuloids were gene edited by lenti paired CRISPR/Cas9 for either PKD1 or PKD2. 1-way-ANOVA with post-hoc Bonferroni in n = 4 mean ± s.d., PKD1-/- tubuloids vs EV tubuloids, ****P <0.0001; PKD2-/- tubuloids vs EV tubuloids, ***P = 0.0006; PKD1-/- tubuloids vs normal tubuloids, ****P <0.0001; PKD2-/- tubuloids vs normal tubuloids, ***P = 0.0004; EV tubuloids vs normal tubuloids, P >0.9999. h, Representative in-situ hybridization of AVPR2, human ADPKD2 kidney tissue section. AVPR2 mRNA was detected in cyst-lining epithelial cells. Scale bar 50 μm. i, Representative immunofluorescent staining of the LOH marker SLC12A1 and AVPR2 in collecting duct epithelial cells. Scale bars 50 μm. j, Representative immunofluorescent staining of the LOH marker SLC12A1 and AVPR2 in ADPKD cyst lining epithelial cells. Scale bars 50 μm. For details on statistics and reproducibility, see Methods.

