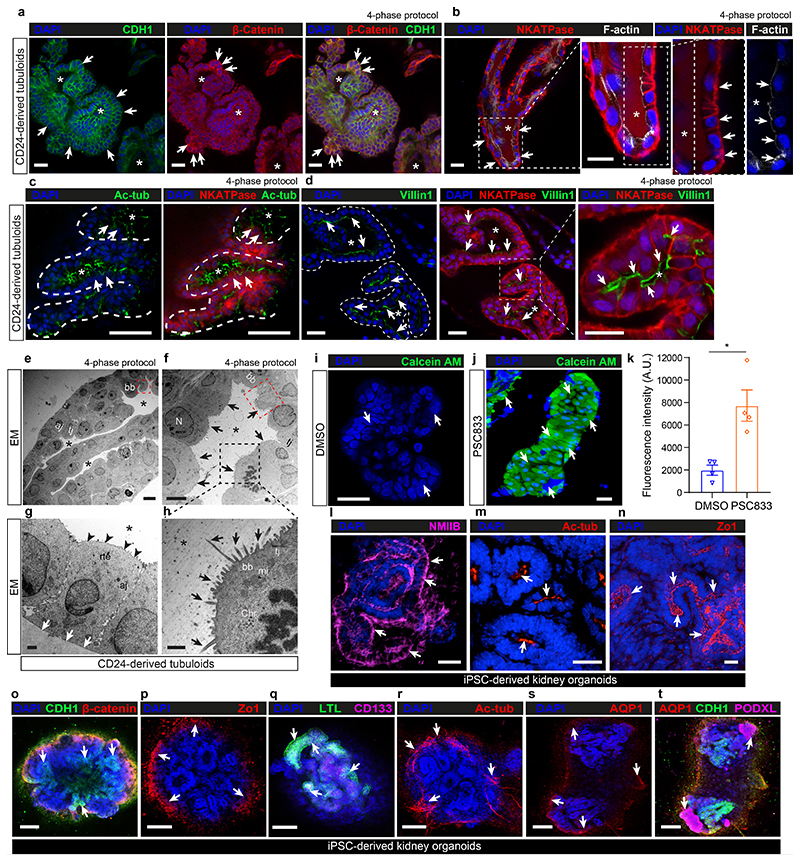
Fig. 3. CD24+-cell-derived tubuloids represent functional proximal tubules while iPSC-derived organoids represent various parts of the adult kidney.
a, Representative images of tubuloids (4-phase) derived from CD24+ cells stained for CDH1 (E-cadherin), β-catenin and DAPI (nuclei). Scale bar 50 μm. b, Representative images of tubuloids (4-phase) stained for Na+/K+-ATPase (NKATPase), apical filamentous actin (F-actin) and DAPI. Scale bar 50 μm. c, Representative images of tubuloids (4-phase) stained for basolateral acetylated tubulin (Ac-tub), Na+/K+-ATPase and DAPI. Scale bar 50 μm. d, Representative images of tubuloids (4-phase) stained for Villin1 (brush border) with Na+/K+-ATPase and DAPI. Scale bar 50 μm. e-h, Representative transmission electron microscopy (TEM) images of tubuloids (4-phase, day 21). Arrows mark cell borders and microvilli (h). N = nucleus; tj = tight junction; aj = adherens junction, bb = brush border, mi = mitochondria, chr = chromosome, rte = renal tubule epithelium; red dashed squares indicate bb; black dashed squares mark cilia. Black arrows mark the apical and white arrows the basolateral side of epithelial cells. Scale bars, 100 μm - e; 5 μm - f; 1 μm - g and h. i-k, Representative images (i-j) and quantification (k) of intracellular calcein-AM accumulation in tubuloids in the presence of the P-gp transporter inhibitor PSC833 or vehicle (0.2% DMSO). two-tailed unpaired t-test with Welch’s correction, n = 4 mean ± s.e.m., *P = 0.0207. Scale bars, 50 μm - i; 100 μm - j. l-t, Representative images of human iPSC-derived kidney organoids stained for NMIIB (l), acetylated tubulin (Ac-tub; m and r), Zo1 (n and p), CDH1 and β-catenin (o), CD133 and LTL (q), AQP1 (s) and AQP1 with podocalyxin (PODXL, t). DAPI was used to counterstain nuclei in all images. Scale bars, 50 μm: o-t; 25 μm. Stars in all images indicate renal tubule lumen(a-h). Arrows indicate positive stainings in immunofluorescent images (a-d, i, j, l-t). For details on statistics and reproducibility, see Methods.

