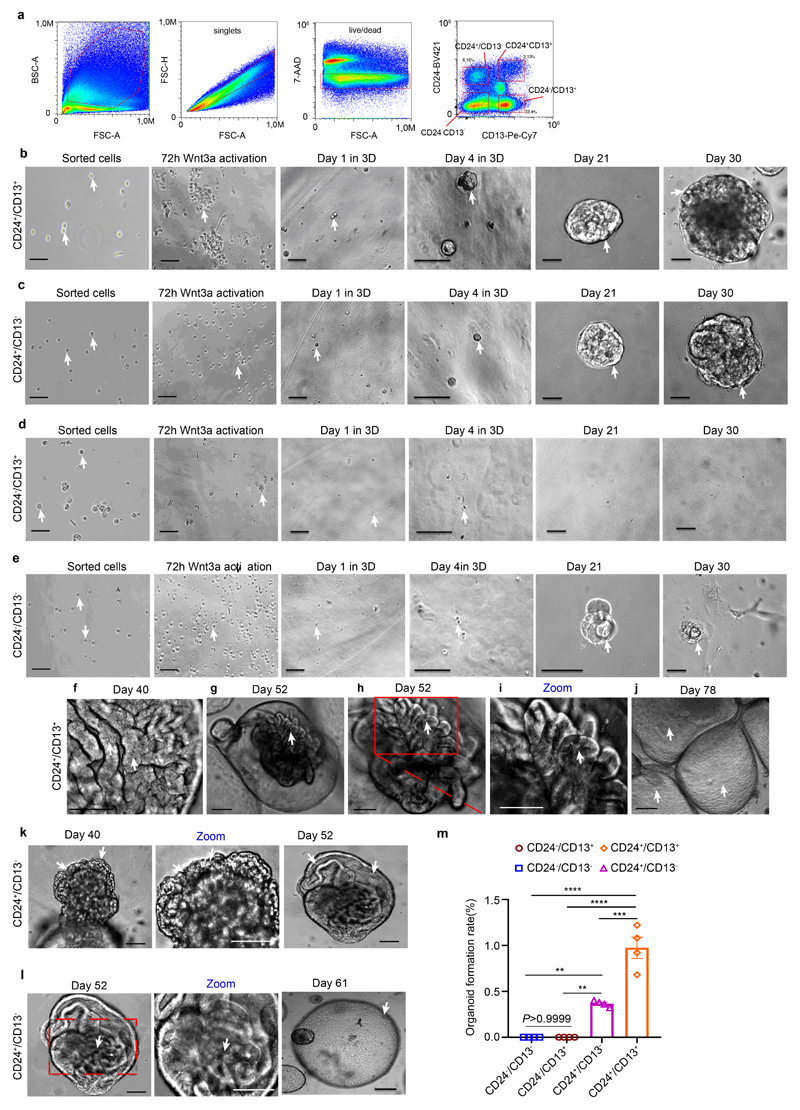
Extended Data Fig. 3. CD24+ cells are the cellular origin of adult kidney tubuloids.
a, FACS gating for sorted CD24+/CD13+, CD24+/CD13-, CD24-/CD13+ and CD24-/CD13- cells. b-e, Representative bright field images of sorted CD24+/CD13+(b); CD24+/CD13-(c); CD24-/CD13+(d) and CD24-/CD13- cells (e) subjected to the 4-phase organoid formation and expansion protocol. Note that only the populations, that contain CD24+ cells were able to form tubuloids (b, c). Arrows mark cells, borders of nephrospheres or tubuloids. Scale bar 100 μm-b-e: sorted cells, 72h Wnt3a, Day 1 in 3D; 50 μm-b-e: Day 4 in 3D, Day 21, Day 30. f-l, Representative DIC (differential interference contrast) images exhibited growth and expansion of tubuloids from CD24+/CD13+ cells(f-j) and CD24+/CD13- cells(k-l). h represents a zoom from g. Red square marks tubuli in a tubuloid at day 52. Arrows mark cells, borders of tubuli or tubuloids. Scale bars, 200 μm: j;100 μm: g, l at -day 61; 50 μm: f, h, i, k at day 40, l at day 52, l -zoom in. m, Comparison of tubuloid formation rates in CD24+/CD13+, CD24+/CD13-, CD24- /CD13+ and CD24-/CD13- cells. Statistical analysis was performed by 2-way ANOVA with post-hoc Bonferroni correction in n = 4 mean ± s.e.m., non-significant, P >0.9999 for CD24-/CD13- vs CD24-/CD13+; **P = 0.0077 for CD24+/CD13- vs CD24-/CD13+ or CD24-/CD13-; ***P = 0.0002 for CD24+/CD13+ vs CD24+/CD13-; ****P <0.0001 for CD24+/CD13+ vs CD24-/CD13+ or CD24-/CD13- cells. Arrows mark cells, borders of cells or tubuloids.

