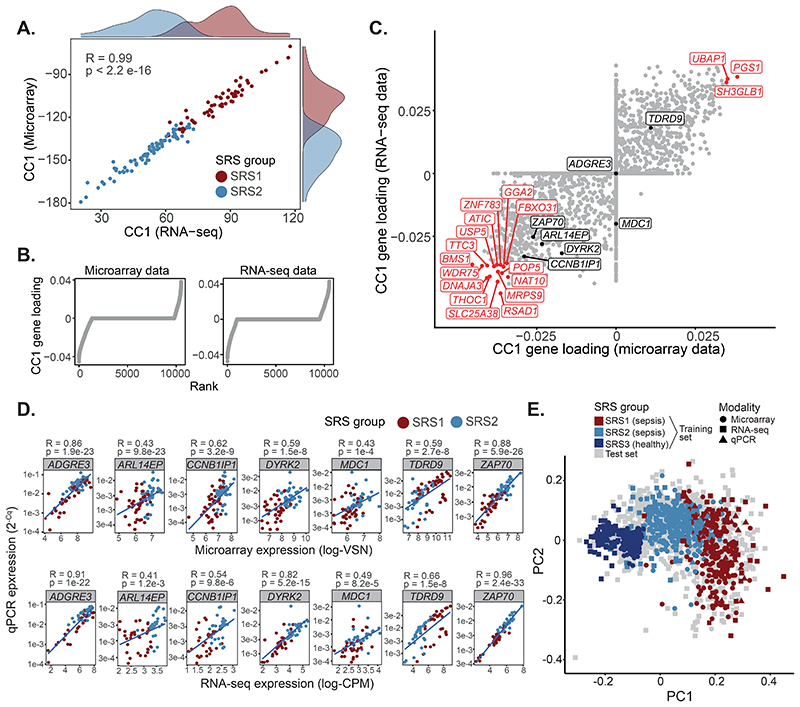
Fig. 1. Construction of a reference map of gene expression in sepsis using data from three different platforms.
(A) CCA analysis of GAinS samples with RNA-seq and microarray data available. Histograms represent marginal SRS1 (red) and SRS2 (blue) distributions. R = Pearson correlation; p = correlation p value. (B) Contribution of each gene to CC1, ranked increasingly. (C) CC1 contribution of each microarray (X axis) and RNA-seq (Y axis) feature. Black and red dots indicate genes in the Davenport signature and amongst the top 1% highest CC1 contributors, respectively. (D) Correlation of microarray/RNA-seq (X axis) and qRT-PCR (Y axis) measurements. Best linear fits are shown. R = Pearson correlation; p = correlation p value. (E) A reference map of sepsis based on the Davenport signature (PCA visualization). Dots represent samples, with shapes indicating profiling platform and colors SRS group.

