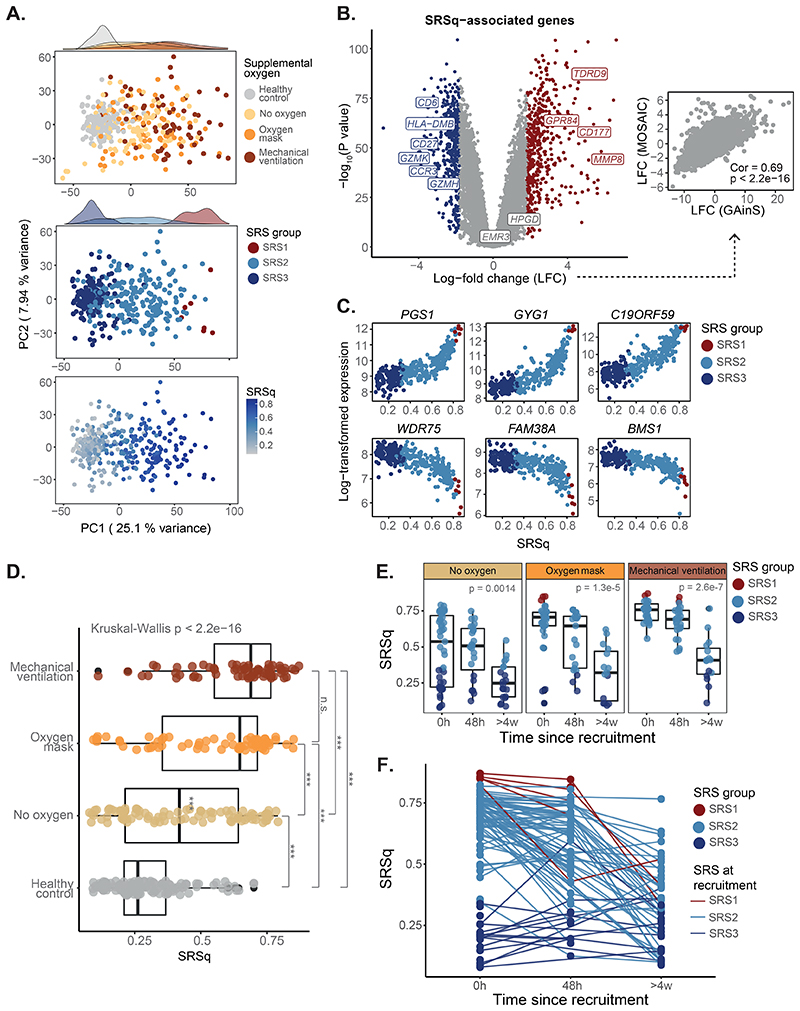
Fig. 6. SRSq predicts oxygen requirement and reveals temporal immune dynamics in influenza.
(A) PCA plots based on whole blood transcriptomes. Samples are colored by oxygen requirement (top), SRS (middle), and SRSq (bottom). (B) Volcano plot showing genes differentially expressed along SRSq. Red indicates positive and blue negative associations with SRSq. The scatter plot (right) compares log-fold changes in sepsis (GAinS) and Influenza. Cor = Pearson correlation; p = correlation p value. (C) Top genes positively (top) and negatively (bottom) associated with SRSq. Samples are colored by SRS group. (D) SRSq stratified by supplemental oxygen requirement; p = Kruskal-Wallis test p value, *** = adjusted Dunn’s post-hoc test p < 0.01. (E) SRSq stratified by time since admission and oxygen requirement. Samples are colored by SRS group. p = Kruskal-Wallis test p value. (F) Line plot showing changes of SRSq over time. Line colors indicate SRS group assignment at recruitment.

