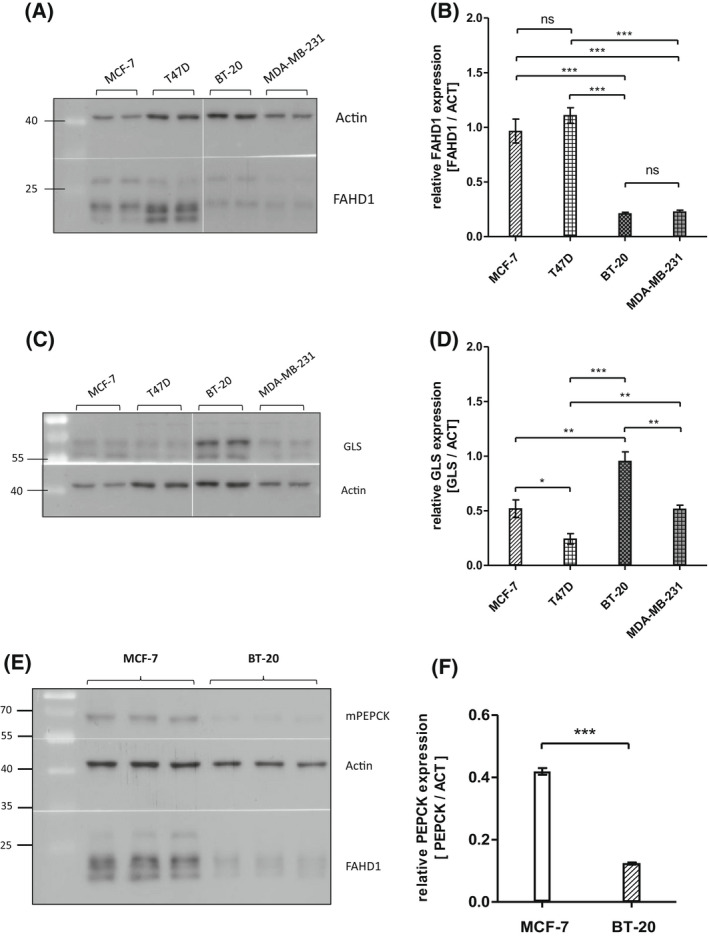
Fig. 1.

Metabolic features of different breast cancer cell lines. (A) Expression patterns of FAHD1 in various wild‐type breast cancer cell lines. (B) Evaluation of FAHD1 expression by densitometry; bars show arithmetic mean and SEM of n = 4 biological replicates. (C) Expression of glutaminase in various wild‐type breast cancer cell lines. (D) Densitometry of glutaminase levels; bars show arithmetic mean and SEM of n = 4 biological replicates. (E) Mitochondrial PEPCK levels in comparison between MCF‐7 and BT‐20; bars show arithmetic mean and SEM of n = 3 biological replicates. (F) Densitometry of mPEPCK levels in MCF‐7 and BT‐20 breast cancer cells, bars show arithmetic mean and SEM of n = 3 biological replicates. Significance threshold for Student's t‐test and one‐way ANOVA: *P ≤ 0.05; **P ≤ 0.01; ***P ≤ 0.001.
