Fig. 5.

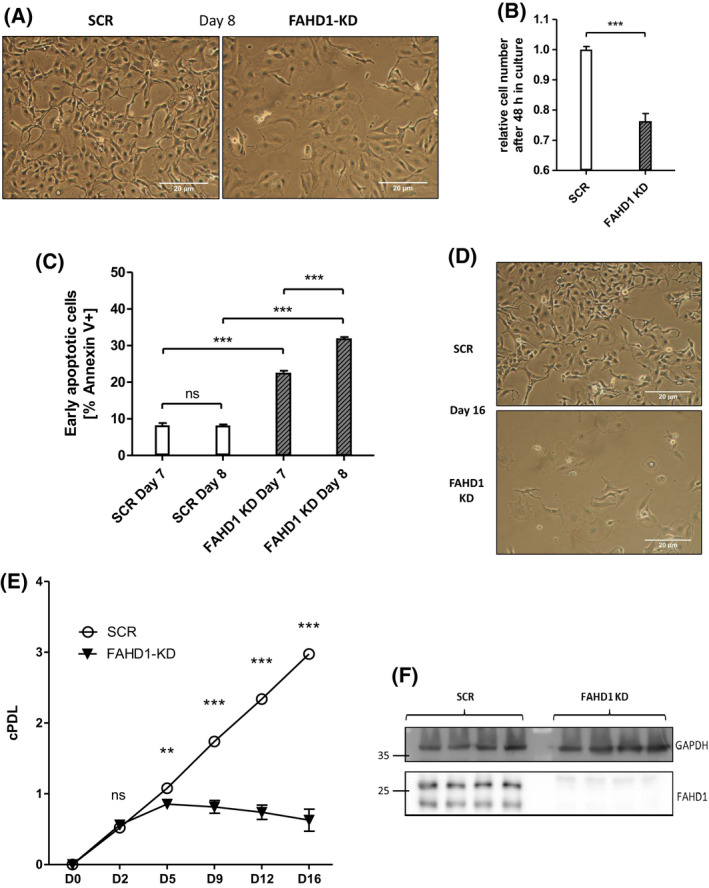
FAHD1 KD causes lower proliferation and cell death in basal BT‐20. (A) Bright field pictures of BT‐20 at day 8 post infection (10 MOI). (B) Cell numbers were monitored between day 7 and day 9 (48 h) post infection with 10 MOI; n = 5 biological replicates with SEM (C) Early apoptosis (Annexin V+) was detected by flow‐cytometry at day 7 and day 8 post infection; n = 3 biological replicates with SEM. (D) Bright field pictures showing collapsed BT‐20 culture upon FAHD1 KD at day 16 post infection. (E) Growth curve of control (SCR) and FAHD1 KD BT‐20 cells over 16 days in culture; n = 3 biological replicates with SEM. (F) Western blot showing depleted FAHD1 expression on protein levels in BT‐20 FAHD1 KD cells. Significance threshold for Student's t‐test: *P ≤ 0.05; **P ≤ 0.01; ***P ≤ 0.001.
