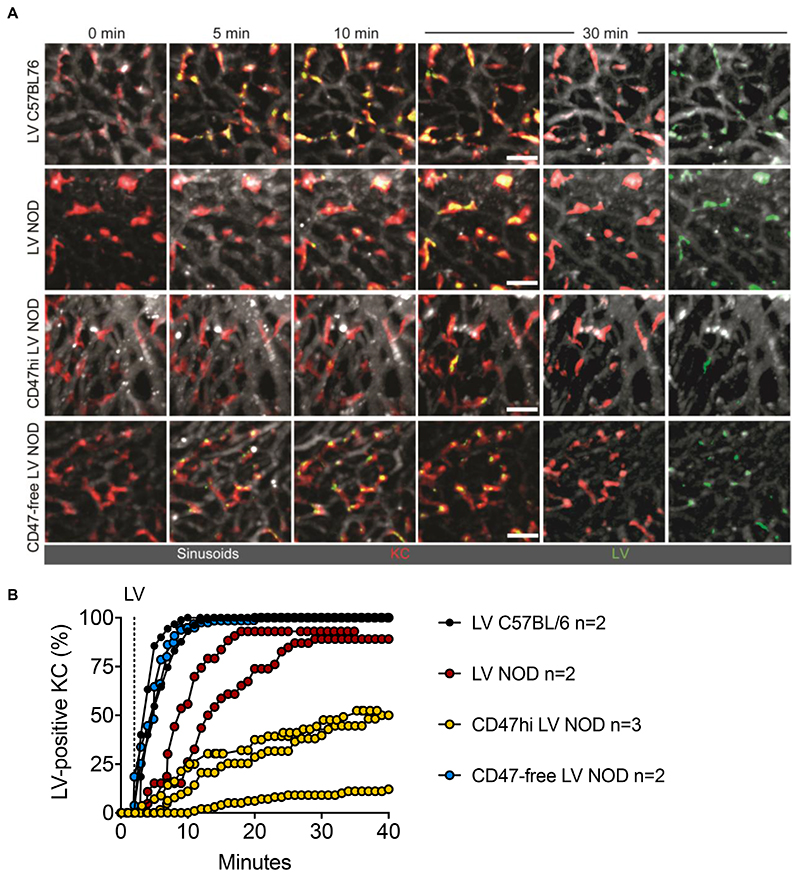
Fig. 3. Intravital imaging of LV, CD47hi or CD47-free LV uptake by liver KC in mice.
(A) IV2PM images from 8–12 z-stacks spacing 4 μm of liver of C57BL/6 or NOD mice treated with GFP-labeled LV, CD47hi or CD47-free LV as indicated, at the indicated time (minutes; note that LV i.v. injection starts at min 2). Sinusoids are labeled in white, KC in red. Scale bar, 30 μm. Separate channels (white and red or white and green) are also shown for the 30-min time point. (B) Single values of the percentage of LV-positive KC (yellow stained) over time in C57BL/6 or NOD mice treated with LV, CD47hi or CD47-free LV, as indicated (analyzed KC per mouse n = 43-130).

