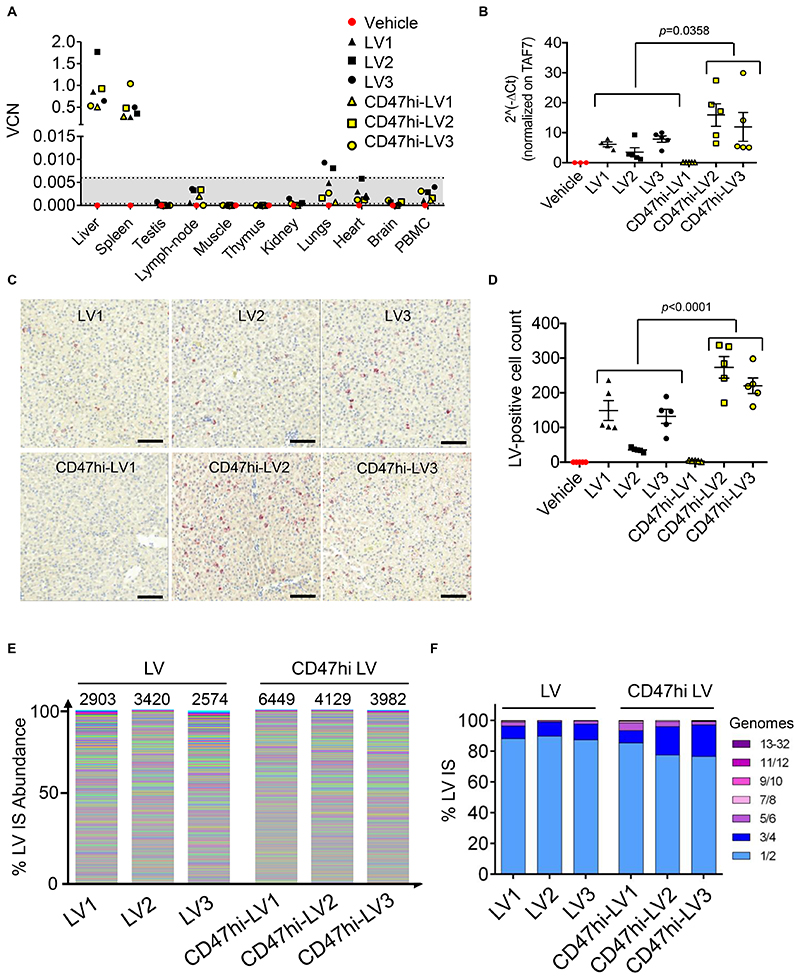
Fig. 5. Selectivity of i.v. LV gene therapy in NHP and IS analysis.
(A) Single values of VCN in the indicated organs of vehicle-, LV- or CD47hi-LV treated NHP at necropsy (90 days post LV). The dashed lines defining the grey area represent the lower limit of detection (0.0004) and the lower limit of quantification (0.006), thus values in the grey area can be detected (different from the negative control), but not reliably quantified (see methods section). (B) Expression analysis by qRT-PCR of WPRE normalized on the endogenous TAF7 gene (2^-ΔCt) on RNA extracted from different liver lobes of LV- or CD47hi-LV treated NHP, as indicated. Mann-Whitney test. (C,D) Counts of LV-RNA positive cells (D, LV-expressing cells) by ISH on liver tissue slices of the indicated NHP (n=5 random fields taken from 5 non-consecutive slides/NHP); representative images are shown in (C). Scale bar 100 μm. Mann-Whitney test. (E,F) Stacked bar plots representing the abundance of each LV IS retrieved from the liver of LV- or CD47hi-LV treated NHP. In (E) each LV IS is represented by a different color with the height in relative proportion with the number of retrieved genomes (frequency) over the total. In (F) the frequency by which individual LV integrations are found in 1 or more genomes are plotted in groups of increasing number of genomes.

