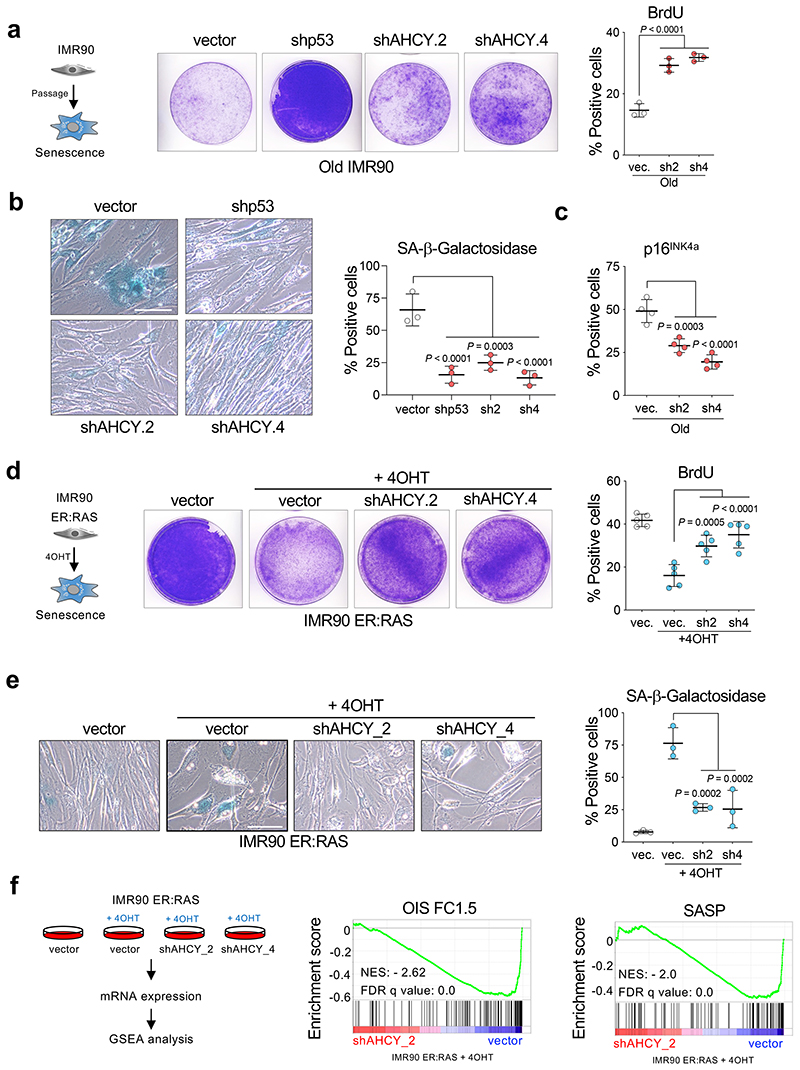
Figure 3. AHCY knockdown attenuates replicative and oncogene-induced senescence.
a, Left, crystal violet-stained, old (PD ~40-44) IMR90 cells infected with different pGIPZ shRNAs against AHCY, TP53 or the parental pGIPZ vector. Images are from a representative experiment out of 3. Right, quantification of immunofluorescence staining for BrdU incorporation in cells from the same experiment (n = 3). b, Left, representative images of SA-β-Galactosidase staining. Scale bar, 100 μm; right, quantification (n = 3). c, Quantification of cells expressing p16INK4a as measured by IF (n = 4). d, Left, crystal violet-stained, cultures of IMR90 ER:RAS cells infected with different pGIPZ shRNAs against AHCY, TP53 or the parental pGIPZ vector. Images are a representative experiment out of 3. Right, quantification of immunofluorescence staining for BrdU of cells from the same experiment (n = 5). e, Left, representative images of SA-β-Galactosidase staining. Scale bar, 100 μm; right, quantification (n = 3). f, Left, experimental design for transcriptional profiling of IMR90 ER:RAS cells infected with two different pGIPZ shRNAs against AHCY or the parental pGIPZ vector. Right, GSEA signatures for oncogene-induced senescence and SASP. All statistical significances were calculated using one-way ANOVA. All error bars represent mean ± s.d; n represents independent experiments.

