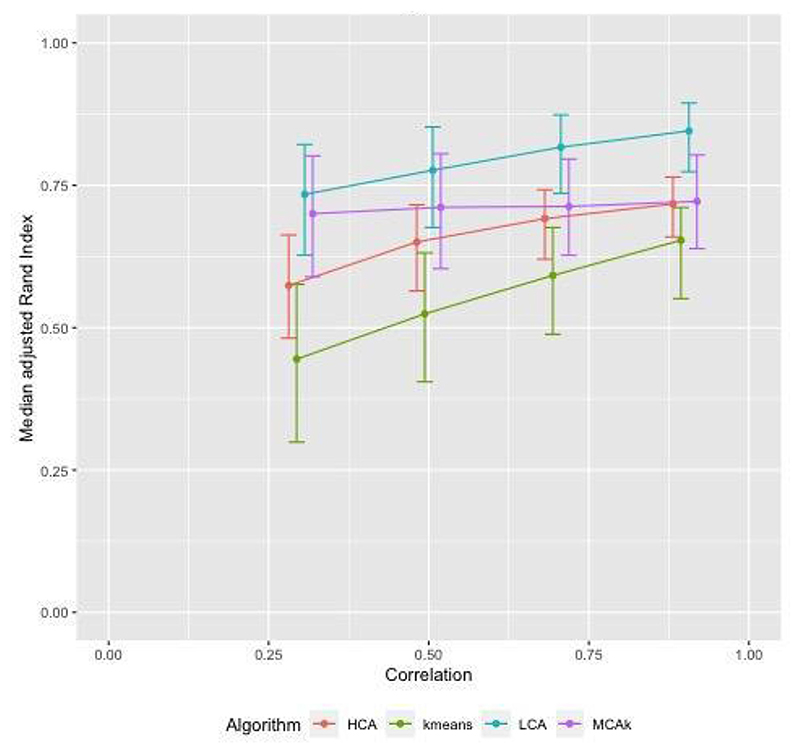
Fig. 1.
Simulated dataset of patients with two or more conditions in 3 clusters, within cluster disease prevalence approximately 15%, noise approximately 0.5%, overlap of diseases between clusters: examining the effect of varying correlation of diseases within a cluster. Error bars show interquartile range (IQR).

