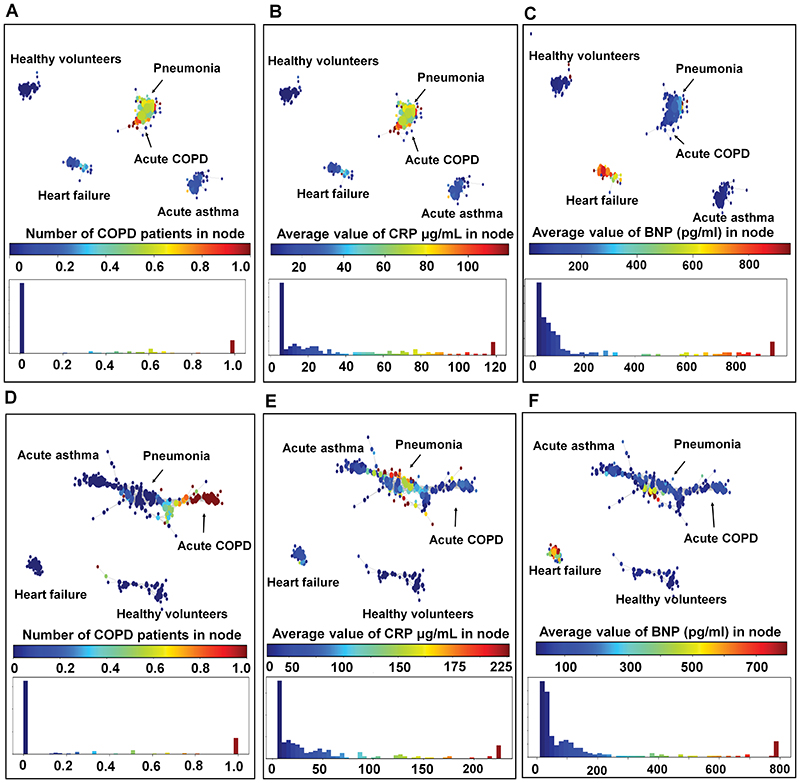
Fig. 2. Topological data analysis (TDA) representing the various acute disease groups annotated by blood biomarkers.
Each circle or ‘node’ in the TDA graph represents a subject or group of subjects. Similar subjects are grouped together in the same node and the relative similarity of the subjects is represented by the proximity of the nodes. The size of each node is determined by the number of subjects within it. A: Visual mapping of the acute disease groups in the discovery cohort (n=139), based on the discriminatory 805 features and coloured by proportion of acute COPD exacerbations in each node. B: The network is colour coded by the average values of CRP in each node in the discovery cohort (n=139). Higher CRP values corresponded topologically with the COPD and pneumonia patients. C: The network is colour coded by the average values of BNP in each node in the discovery cohort (n=139). Higher BNP values corresponded topologically with the heart failure patients. D: The network is coloured by proportion of acute COPD exacerbations in each node in the replication cohort (n=138). In replication cohort, Pneumonia and COPD exacerbation subjects occupied polar ends of the same TDA network. E: The networks are coloured by the average values of CRP in each node. High CRP values corresponded topologically with the pneumonia subjects. F: The networks are coloured by the average values of BNP in each node. High BNP values corresponded topologically with the heart failure subjects.

