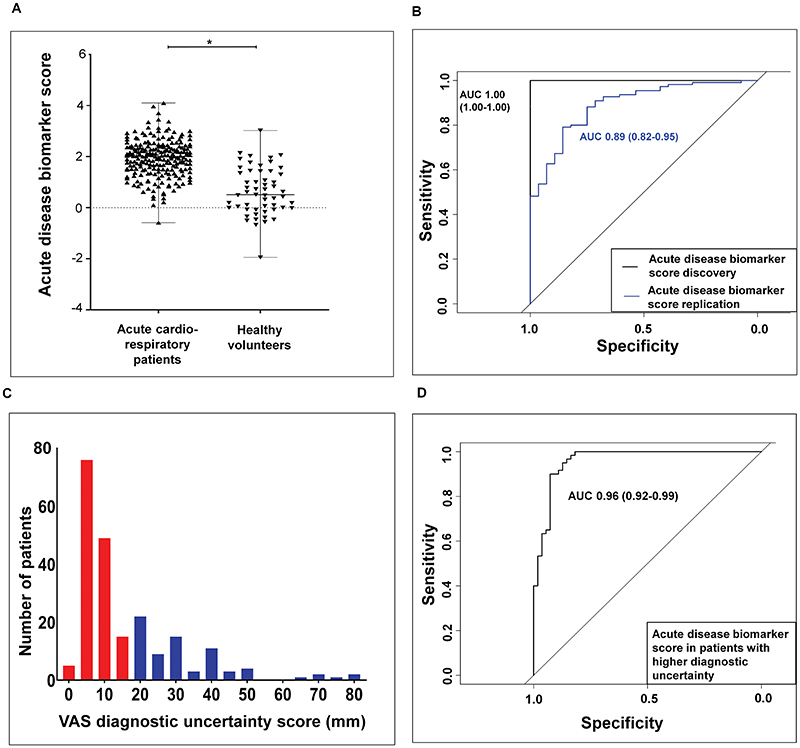
Fig. 3. Diagnostic accuracy of an acute VOC biomarker score.
A Scatter plot demonstrating significant difference between breath VOC biomarker score values in acute cardiorespiratory patients compared to healthy volunteers. The black horizontal line within the scatter plot represents the median value of the biomarker score. Mann Whitney test *P < 0.0001. B: Receiver operating characteristic (ROC) curve of participants in the discovery [black line - AUC 1.00 (1.00-1.00)] and replication [blue line - AUC 0.89 (0.82-0.95)] cohorts P < 0.0001. C: Histogram showing the number of patients with higher diagnostic uncertainty (blue bars with values > upper quartile value of 20 mm). D: ROC curve assessing the discriminatory power of exhaled breath VOCs in participants with higher diagnostic uncertainty. AUC 0.96 (0.92-.99) P < 0.0001

