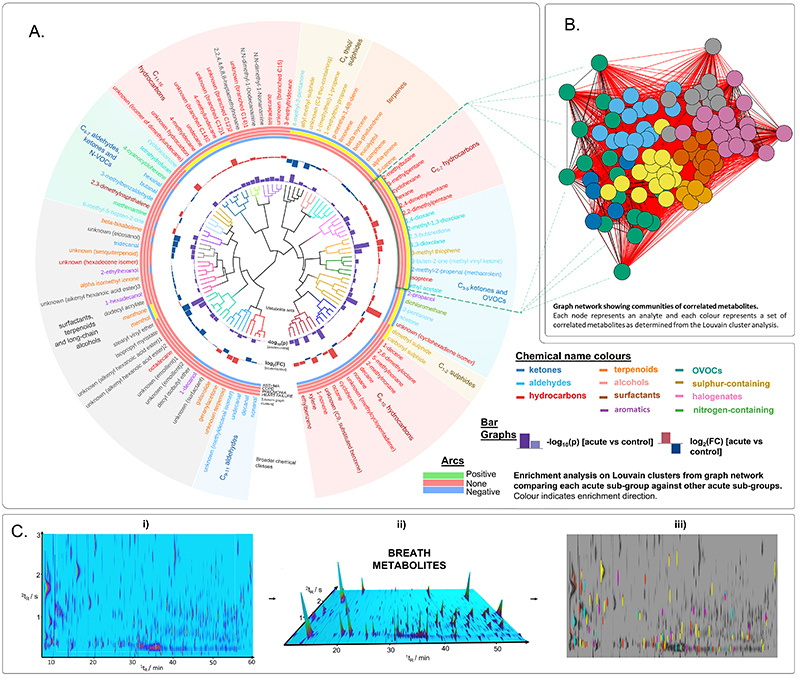
Fig. 5. VOC biomarker chemical enrichment in acute cardiorespiratory exacerbations.
A: Circular correlation tree generated based on metabolite set enrichment and chemical similarity analysis of 101 breath volatiles associated with acute breathlessness. Branches depict metabolite sets derived using the ChemRICH; bar graphs portray -log10(p) and log2(fold change) values of 101 features extracted using LASSO regression (table S4) in acute breathlessness compared with control group. The arcs represent the Louvain clusters, derived from the correlation graph (green for upregulated, red for not significant, blue for downregulated according to K-S test result). Chemical names are coloured based on their chemical classification and coloured regions used to summarise broader chemical groups. B: Correlation graph showing metabolite communities identified using Louvain clustering, with the identity and location of the cluster enriched in heart failure projected onto the circular dendrogram. C: i) Example GCxGC chromatogram showing complex profile of breath metabolites; ii) 3D render of chromatogram showing visualisation of breath markers; and iii) phenotypic differences based on features included in the breath biomarker scores (table S9) (yellow, asthma; red, pneumonia; magenta, COPD; cyan, heart failure).

